|
Financial Highlights
|
|
|
|
|
Percent
Change |
|
|
|
|
|
|
| (thousands,
except per share) |
2001 |
2000 |
1999 |
2001 |
2000 |
|
|
|
|
|
|
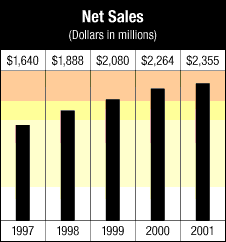
| Net
Sales |
$2,354,723 |
$2,264,313 |
$2,080,012 |
4% |
9% |
| Net
Income |
188,170 |
206,127 |
175,786 |
(9) |
17 |
| Percent
of Sales |
8.0% |
9.1% |
8.5% |
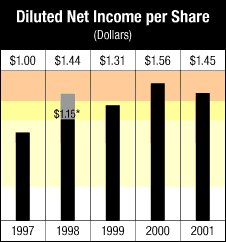
| Diluted
Net Income Per Common Share |
1.45 |
1.56 |
1.31 |
(7) |
19 |
| Diluted
Weighted-Average Common Shares Outstanding |
129,928 |
131,946 |
134,419 |
(2) |
(2) |
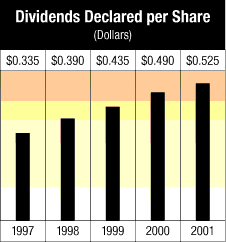
| Cash
Dividends Declared per Common Share |
0.525 |
0.490 |
0.435 |
7 |
13 |
| Cash
Provided by Operating Activities |
364,481 |
315,486 |
293,494 |
16 |
7 |
| Capital
Expenditures |
157,937 |
150,009 |
145,622 |
5 |
3 |
| Shareholders'
Equity |
880,352 |
757,007 |
762,016 |
16 |
(1) |
| Return
on Beginning Equity |
24.9% |
27.1% |
25.5% |
| Total
Debt |
745,673 |
370,969 |
281,074 |
101 |
32 |
| Total
Debt to Capitalization |
45.9% |
32.9% |
26.9% |
|
|
|
|
|
|
| Total
Assets |
$2,525,000 |
$1,714,011 |
$1,585,946 |
47% |
8%
|
|
|
|
|
|
|
|