|
 |
 |
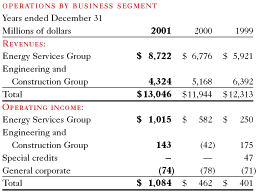
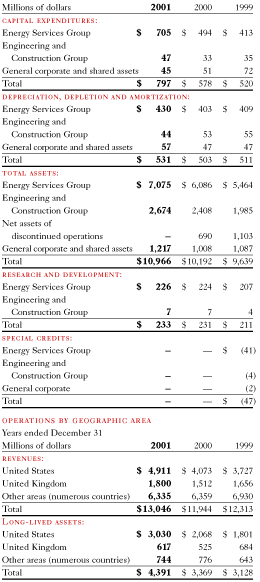
The tables below present information on our continuing operations business segments.


Inventories to support continuing operations at December 31, 2001 and 2000 are composed of the following:

Inventories on the last-in, first-out method were $54 million at December 31, 2001 and $66 million at December 31, 2000. If the average cost method had been used, total inventories would have been about $20 million higher than reported at December 31, 2001, and $28 million higher than reported at December 31, 2000.
Property, plant and equipment to support continuing operations at December 31, 2001 and 2000 are composed of the following:

At December 31, 2001 machinery, equipment and other property includes oil and gas investments of approximately $423 million and software developed for an information system of $233 million. At December 31, 2000 machinery, equipment and other property includes oil and gas investments of approximately $363 million and software developed for an information system of $223 million.
|
|
|