Financial Information
Jump to a Section:
PART II
Item 7. Management’s Discussion and Analysis of Financial Condition and Results of Operations.
BUSINESS SEGMENTS
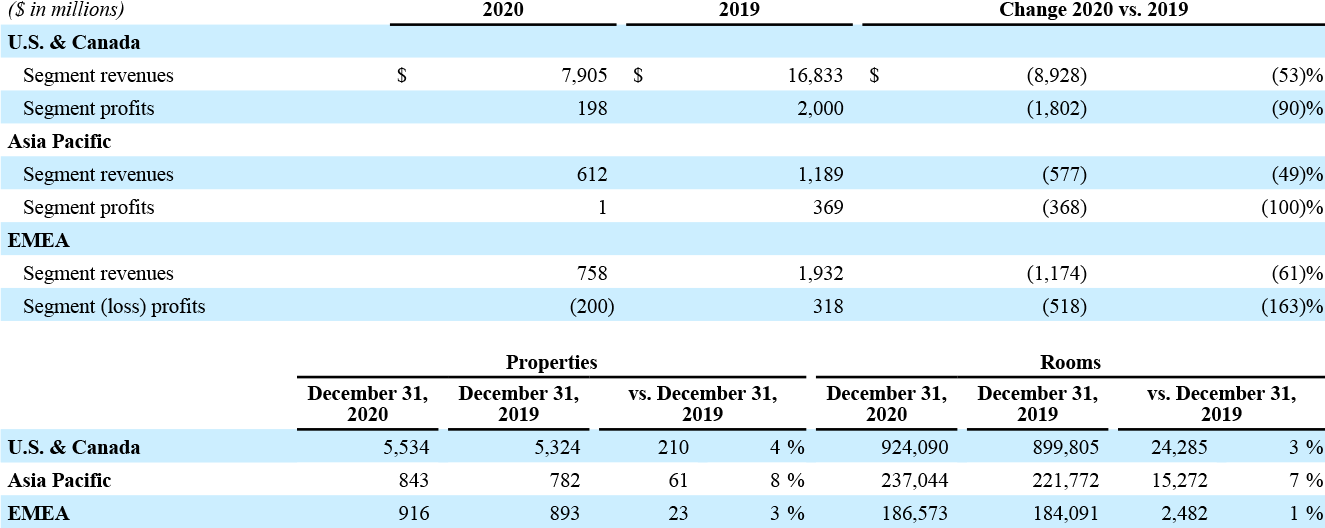
Our segment results declined in 2020 compared to 2019 primarily due to the impact of COVID-19. See the “Impact of COVID-19” section above for more information about the impact to our business during 2020 and the discussion below for additional analysis of the operating results of our reportable business segments. Segment revenues and profits for EMEA, a new reportable segment in 2020, did not change significantly in 2019 compared to 2018.

U.S. & Canada
U.S. & Canada segment profits decreased primarily due to the following:
- $1,351 million of lower gross fee revenues (primarily reflecting lower comparable systemwide RevPAR and net house profits driven by decreases in both occupancy and ADR due to lower demand resulting from COVID-19, partially offset by unit growth of $32 million);
- $60 million of higher contract investment amortization costs (primarily reflecting higher contract impairment charges);
- $158 million of lower owned, leased, and other revenue, net of direct expenses (including $19 million from hotels sold in the 2019 fourth and 2020 first quarters);
- $22 million of higher general, administrative, and other expenses (primarily reflecting $75 million of higher provision for credit losses and reserves for guarantee funding, partially offset by $48 million of lower administrative costs due to our cost reduction measures);
- $141 million of lower gains and other income, net (primarily reflecting a $134 million gain on the sale of two properties in 2019);
- $101 million of lower equity in (losses) earnings due to impairment charges ($60 million) and losses recorded by investees, primarily as a result of COVID-19; and
- $27 million of higher restructuring and merger-related charges;
partially offset by:
- $49 million of higher cost reimbursement revenue, net of reimbursed expenses.
Asia Pacific
Asia Pacific segment profits decreased primarily due to the following:
- $294 million of lower gross fee revenues (primarily reflecting lower comparable systemwide RevPAR and net house profits driven by decreases in both occupancy and ADR due to lower demand resulting from COVID-19);
- $39 million of lower owned, leased, and other revenue, net of direct expenses;
- $9 million of lower cost reimbursement revenue, net of reimbursed expenses; and
- $25 million of lower equity in (losses) earnings;
partially offset by:
- $13 million of lower general, administrative, and other expenses (primarily reflecting lower expenses due to COVID-19).
EMEA
EMEA segment loss, compared to prior year profits, primarily reflects the following:
- $308 million of lower gross fee revenues (primarily reflecting lower comparable systemwide RevPAR and net house profits driven by decreases in both occupancy and ADR due to lower demand resulting from COVID-19);
- $171 million of lower owned, leased, and other revenue, net of direct expenses;
- $25 million of lower cost reimbursement revenue, net of reimbursed expenses; and
- $11 million of lower equity in (losses) earnings;
partially offset by:
- $13 million of lower general, administrative, and other expenses (primarily reflecting lower expenses due to COVID-19, partially offset by a $24 million higher provision for credit losses).