Financial Information
Jump to a Section:
PART II
Item 8. Financial Statements and Supplementary Data.
MARRIOTT INTERNATIONAL, INC.
NOTES TO CONSOLIDATED FINANCIAL STATEMENTS
NOTE 15. BUSINESS SEGMENTS
We discuss our operations in the following three reportable business segments: United States and Canada (“U.S. & Canada”); Asia Pacific; and Europe, Middle East and Africa (“EMEA”). Our Caribbean and Latin America (“CALA”) operating segment does not meet the applicable accounting criteria for separate disclosure as a reportable business segment, and we include its results in “Unallocated corporate and other.” In the 2020 fourth quarter, we changed the name of our largest segment from “North America” to “U.S. & Canada.” Other than the name change, we made no other changes to the composition of this segment. In January 2021, we modified our reportable segment structure as a result of a change in the way management intends to evaluate results and allocate resources within the Company. Beginning with the 2021 first quarter, we will report the following two operating segments: U.S. & Canada and International.
We evaluate the performance of our operating segments using “segment profits/loss” which is based largely on the results of the segment without allocating corporate expenses, income taxes, indirect general, administrative, and other expenses, merger-related costs, or above-property restructuring charges. We assign gains and losses, equity in earnings or losses, direct general, administrative, and other expenses, and other restructuring charges to each of our segments. “Unallocated corporate and other” includes a portion of our revenues, including license fees we receive from our credit card programs, fees from vacation ownership licensing agreements, revenues and expenses for our Loyalty Program, general, administrative, and other expenses, restructuring and merger-related charges, equity in earnings or losses, and other gains or losses that we do not allocate to our segments as well as results of our CALA operating segment.
Our chief operating decision maker monitors assets for the consolidated Company, but does not use assets by operating segment when assessing performance or making operating segment resource allocations.
Segment Revenues
The following tables present our revenues disaggregated by segment and major revenue stream for the last three fiscal years:
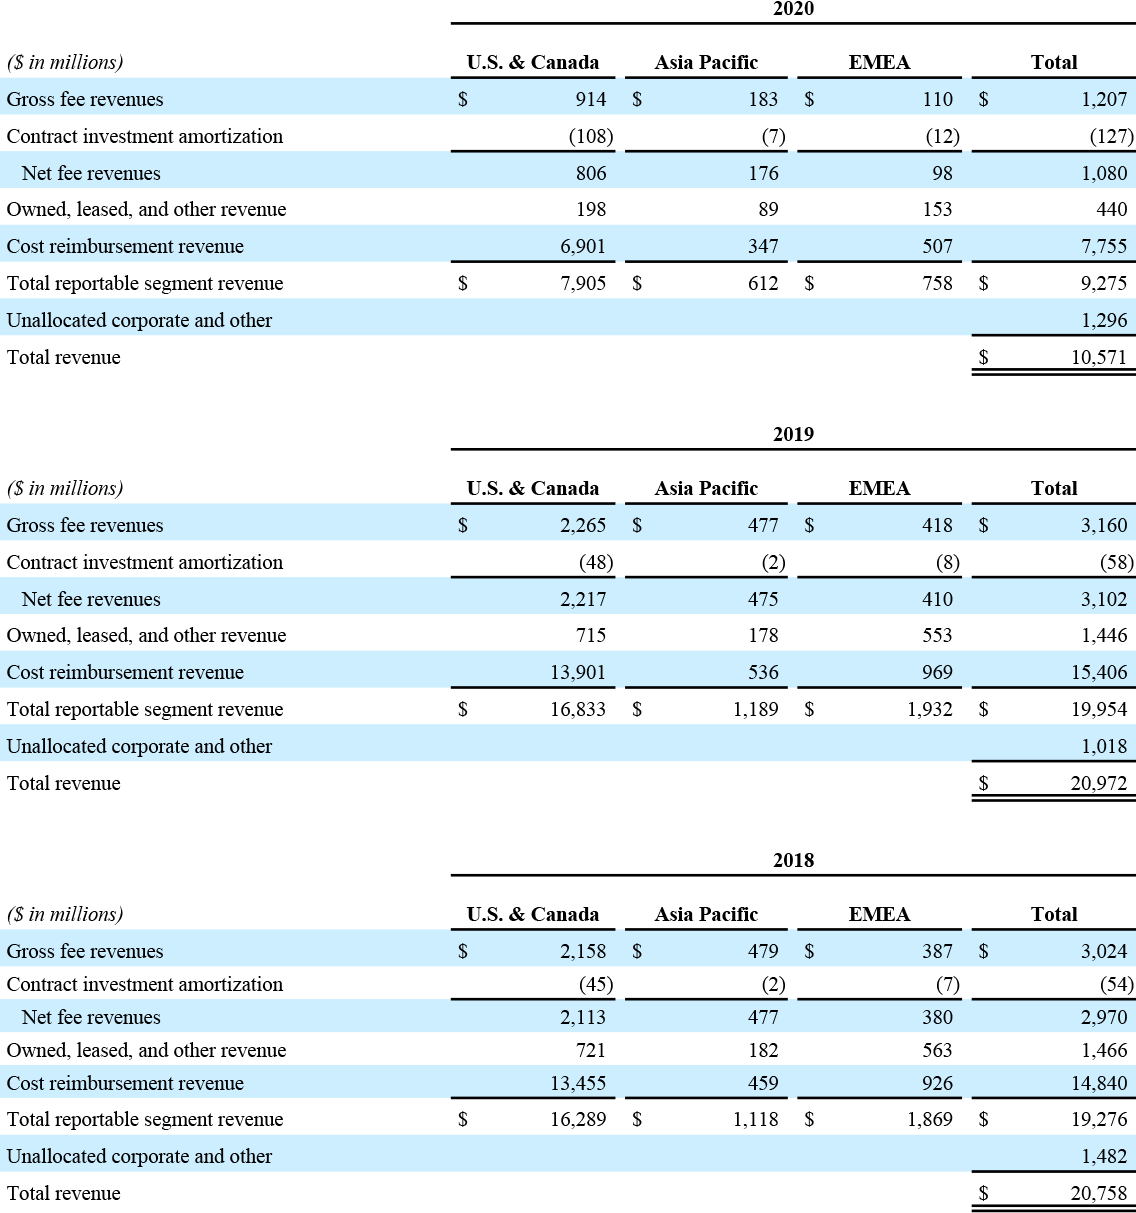
Revenues attributed to operations located outside the U.S. were $1,910 million in 2020, $4,400 million in 2019, and $4,246 million in 2018, including cost reimbursement revenue outside the U.S. of $1,247 million in 2020, $2,394 million in 2019, and $2,244 million in 2018.
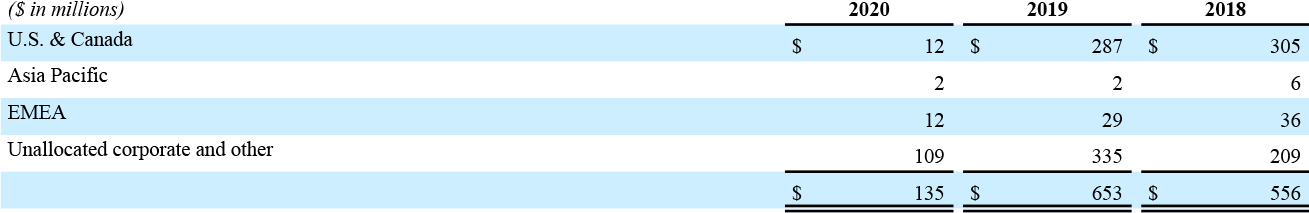
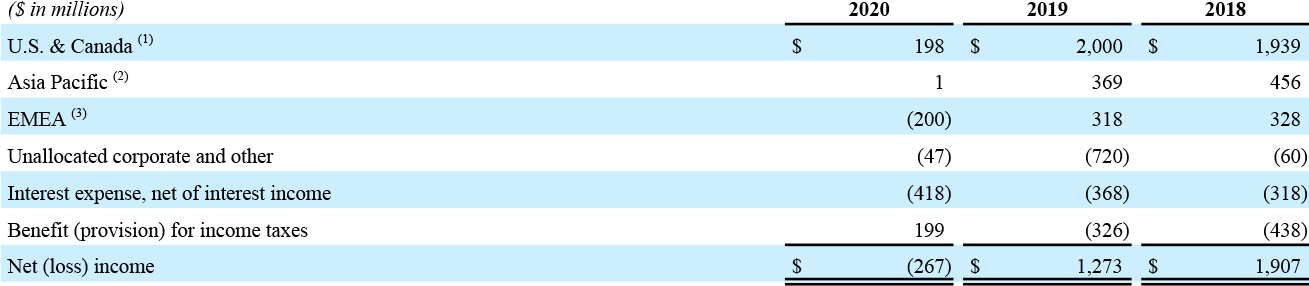
Segment Profits and Losses
(1) Includes cost reimbursements, net of $(80) million in 2020, $(129) million in 2019, and $(121) million in 2018.
(2) Includes cost reimbursements, net of $(18) million in 2020, $(9) million in 2019, and zero in 2018.
(3) Includes cost reimbursements, net of $(33) million in 2020, $(8) million in 2019, and zero in 2018.
Segment (losses) profits attributed to operations located outside the U.S. were $(198) million in 2020, $982 million in 2019, and $1,155 million in 2018, including cost reimbursements, net (cost reimbursement revenue, net of reimbursed expenses) outside the U.S. of $(62) million in 2020, $(18) million in 2019, and $(14) million in 2018.
Depreciation, Amortization, and Other
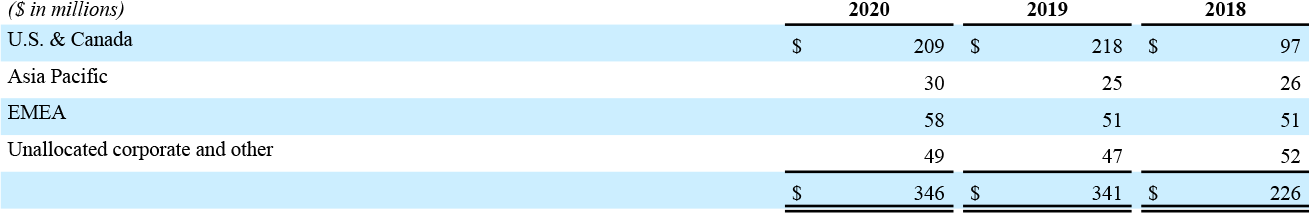
Capital Expenditures