 Financial Information
Equity in Losses
2013 Compared to 2012
Equity in losses of $5 million in 2013 improved by $8 million from equity in losses of $13 million in 2012. The change primarily reflected a favorable variance from the following 2012 items: (1) $8 million in losses at a Luxury segment joint venture for the impairment of certain underlying residential properties; and (2) a $2 million loan loss provision for certain notes receivable due from another Luxury segment joint venture. These favorable variances were partially offset by a $4 million impairment charge in the 2013 second quarter associated with a corporate joint venture (not allocated to one of our segments) that we determined was fully impaired because we did not expect to recover the investment.
2012 Compared to 2011
Equity in losses of $13 million in 2012 was unchanged from equity in losses of $13 million in 2011, and reflected a $4 million decrease in equity in losses across our lodging business, entirely offset by a $4 million unfavorable variance due to the impact of the spin-off. The $4 million decrease in equity in losses across our lodging business primarily reflected $3 million of increased earnings at two International segment joint ventures, $3 million of decreased losses at two other joint ventures, and a $3 million favorable variance from the 2012 sale of an equity interest in a North American Limited-Service joint venture (formerly two joint ventures which were merged before the sale) which had losses in the prior year, partially offset by $3 million of increased losses at a Luxury segment joint venture, and a $2 million loan loss provision for certain notes receivable due from another Luxury segment joint venture. The $3 million of increased losses at a Luxury segment joint venture reflected increased losses of $8 million primarily from the impairment of certain underlying residential properties in 2012, partially offset by $5 million of decreased losses in 2012, after the impairment, as a result of decreased joint venture costs. The $4 million unfavorable variance due to the impact of the spin-off reflected the $4 million reversal in 2011 of the funding liability associated with Timeshare-strategy impairment charges we originally recorded in 2009. See Footnote No. 18, “Timeshare Strategy-Impairment Charges” of our 2011 Form 10-K for additional information on this reversal.
Net Income
2013 Compared to 2012
Net income increased by $55 million to $626 million in 2013 from $571 million in 2012, and diluted earnings per share increased by $0.28 per share (16 percent) to $2.00 per share from $1.72 per share in 2012. As discussed in more detail in the preceding sections beginning with “Revenues,” or as shown in the Consolidated Statements of Income, the $55 million increase in net income was due to higher franchise fees ($59 million), higher base management fees ($40 million), higher incentive management fees ($24 million), lower interest expense ($17 million), lower equity in losses ($8 million), lower income taxes ($7 million), higher owned, leased, corporate housing, and other revenue, net of direct expenses ($6 million), and higher interest income ($6 million). These increases were partially offset by higher general, administrative, and other expenses ($81 million) and lower gains and other income ($31 million).
2012 Compared to 2011
Net income increased by $373 million to $571 million in 2012 from $198 million in 2011, and diluted earnings per share increased by $1.17 per share (213 percent) to $1.72 per share from $0.55 per share in 2011. As discussed in more detail in the preceding sections beginning with “Revenues,” or as shown in the Consolidated Statements of Income, the $373 million increase in net income was due to the impact of the spin-off ($296 million), as well as the following increases across our lodging business: higher gains and other income ($52 million), higher franchise fees ($44 million), higher incentive management fees ($37 million), higher base management fees ($35 million), higher owned, leased, corporate housing, and other revenue, net of direct expenses ($25 million), lower general, administrative, and other expenses ($8 million), and lower equity in losses ($4 million). These increases were partially offset by higher income taxes ($120 million) as well as the following decreases across our lodging business: lower interest income ($6 million) and higher interest expense ($2 million).
Former Timeshare Segment - 2012 Compared to 2011
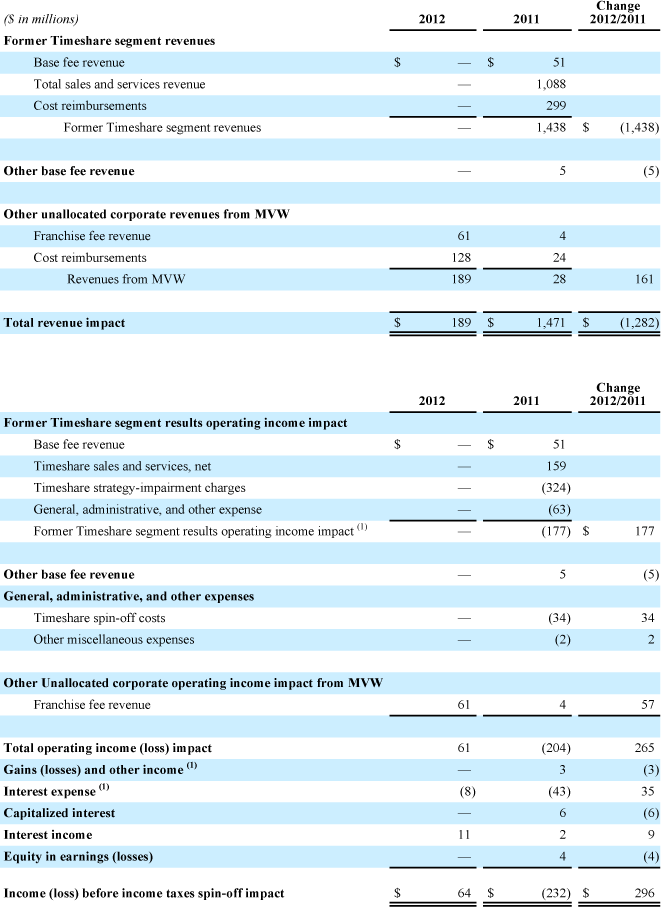
The following tables facilitate the comparison of 2012 to 2011 by detailing the components of our former Timeshare segment revenues and results for 2011, as well as certain items that we did not allocate to our Timeshare segment for 2011 while also showing the components of revenue, interest income and interest expense we received from MVW for 2012.

(1) Timeshare segment results for year-end 2011 totaled a segment loss of $217 million and consisted of $177 million of operating losses, $43 million of interest expense, and $3 million of gains and other income.
