
Page 19 - 2017 AMETEK Annual Report (Interactive) Updated mobile
P. 19
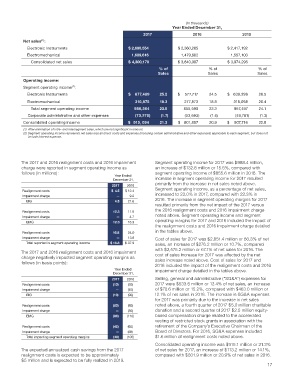
(In thousands)
                                                                         Year Ended December 31,
                                                             2017                 2016                2015
                  (1)
           Net sales :
             Electronic Instruments                    $  2,690,554         $  2,360,285         $  2,417,192
             Electromechanical                             1,609,616            1,479,802               1,557,103
               Consolidated net sales                  $  4,300,170         $  3,840,087         $   3,974,295
                                                                   % of                 % of                 % of
                                                                   Sales                Sales                Sales
           Operating income:
           Segment operating income :
                               (2)
             Electronic Instruments                    $     677,489  25.2    $     577,717  24.5    $     639,399  26.5
             Electromechanical                                310,875  19.3          277,873  18.8           318,098  20.4
               Total segment operating income                 988,364  23.0          855,590  22.3           957,497  24.1
               Corporate administrative and other expenses           (73,270)  (1.7)           (53,693)  (1.4)            (49,781)  (1.3)
           Consolidated operating income                $     915, 094  21.3     $     801,897  20.9     $     907,716  22.8
           (1)  After elimination of intra- and intersegment sales, which are not significant in amount.
           (2) Segment operating income represents net sales less all direct costs and expenses (including certain administrative and other expenses) applicable to each segment, but does not
             include interest expense.


          The 2017 and 2016 realignment costs and 2016 impairment   Segment operating income for 2017 was $988.4 million,
          charge were reported in segment operating income as     an increase of $132.8 million or 15.5%, compared with
          follows (in millions):                                  segment operating income of $855.6 million in 2016. The
                                                 Year Ended
                                                December 31,      increase in segment operating income for 2017 resulted
                                                2017  2016        primarily from the increase in net sales noted above.
          Realignment costs                         $    4.5    $ 12.4  Segment operating income, as a percentage of net sales,
          Impairment charge                          —       9.2  increased to 23.0% in 2017, compared with 22.3% in
               EIG                                    4.5       21.6  2016. The increase in segment operating margins for 2017
                                                                  resulted primarily from the net impact of the 2017 versus
                                                                  the 2016 realignment costs and 2016 impairment charge
          Realignment costs                          12.3       11.6
          Impairment charge                           —         4.7  noted above. Segment operating income and segment
               EMG                                 12.3       16.3  operating margins for 2017 and 2016 included the impact of
                                                                  the realignment costs and 2016 impairment charge detailed
          Realignment costs                             16.8       24.0  in the tables above.
          Impairment charge                          —       13.9  Cost of sales for 2017 was $2,851.4 million or 66.3% of net
             Total reported in segment operating income           $ 16.8    $ 37.9  sales, an increase of $276.2 million or 10.7%, compared
                                                                  with $2,575.2 million or 67.1% of net sales for 2016. The
          The 2017 and 2016 realignment costs and 2016 impairment
          charge negatively impacted segment operating margins as   cost of sales increase for 2017 was affected by the net
          follows (in basis points):                              sales increase noted above. Cost of sales for 2017 and
                                                                  2016 included the impact of the realignment costs and 2016
                                                 Year Ended       impairment charge detailed in the tables above.
                                                December 31,
                                                2017  2016        Selling, general and administrative (“SG&A”) expenses for
          Realignment costs                             (10)       (50)  2017 were $533.6 million or 12.4% of net sales, an increase
          Impairment charge                                    —     (40)  of $70.6 million or 15.2%, compared with $463.0 million or
               EIG                                  (10)       (90)  12.1% of net sales in 2016. The increase in SG&A expenses
                                                                  for 2017 was primarily due to the increase in net sales
          Realignment costs                          (80)       (80)  noted above, a fourth quarter of 2017 $5.0 million charitable
          Impairment charge                          —       (30)  donation and a second quarter of 2017 $2.5 million equity-
               EMG                               (80)      (110)  based compensation charge related to the accelerated
                                                                  vesting of restricted stock grants in association with the
          Realignment costs                            (40)       (60)  retirement of the Company’s Executive Chairman of the
          Impairment charge                         —       (40)  Board of Directors. For 2016, SG&A expenses included
             Total impacting segment operating margins                (40)      (100)  $1.6 million of realignment costs noted above.
                                                                  Consolidated operating income was $915.1 million or 21.3%
          The expected annualized cash savings from the 2017      of net sales for 2017, an increase of $113.2 million or 14.1%,
          realignment costs is expected to be approximately       compared with $801.9 million or 20.9% of net sales in 2016.
          $5 million and is expected to be fully realized in 2019.
                                                                                                                 17