Shareholder Return Performance Graph >
|
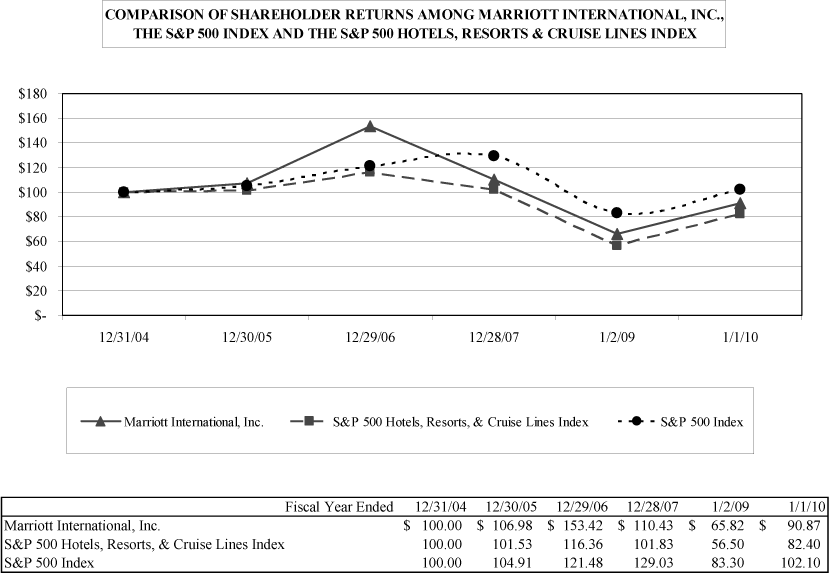
SHAREHOLDER RETURN PERFORMANCE GRAPH — UNAUDITED The following graph compares the performance of the Company's Class A Common Stock from December 31, 2004 to the end of fiscal 2009 with the performance of the Standard & Poor's Corporation Composite 500 Index and the Standard & Poor's Hotels, Resorts & Cruise Lines Index. The graph assumes an initial investment of $100 on December 31, 2004, and reinvestment of dividends. |
|
|
|
> Back to top of page |
|

