Financial Information
Jump to a Section:
SHAREHOLDER RETURN PERFORMANCE GRAPH
SHAREHOLDER RETURN PERFORMANCE GRAPH
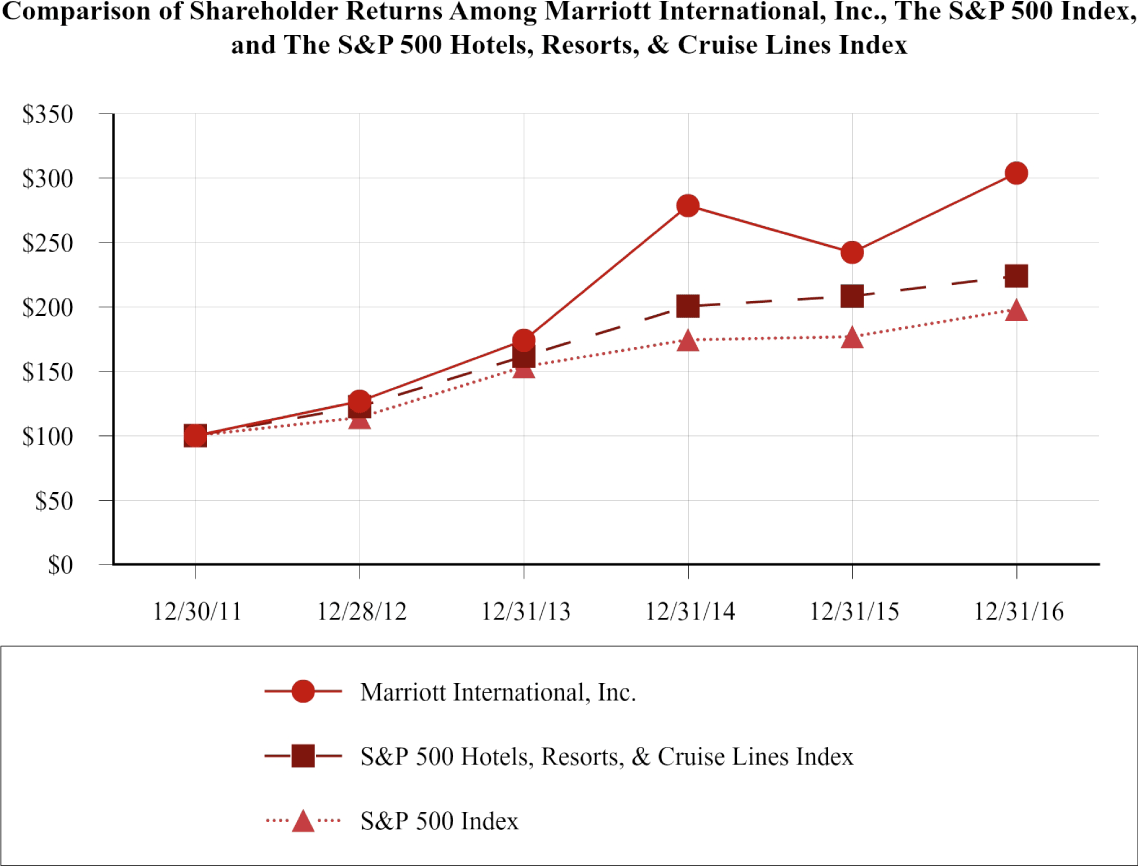
The following graph compares the performance of our Class A Common Stock from December 30, 2011 to the end of fiscal year 2016 with the performance of the Standard & Poor’s Corporation Composite 500 Index and the Standard & Poor’s Hotels, Resorts & Cruise Lines Index. The graph assumes an initial investment of $100 on December 30, 2011, and reinvestment of dividends.


NOTE: At the end of fiscal year 2016, the S&P 500 Hotels, Resorts & Cruise Lines Index consisted of Carnival Corporation, Marriott International, Inc., Wyndham Worldwide Corporation and Royal Caribbean Cruises Ltd. Royal Caribbean Cruises Ltd is an addition to the index from the end of the 2013 fiscal year. Starwood Hotels & Resorts Worldwide Inc. was removed from the index in 2016.