27
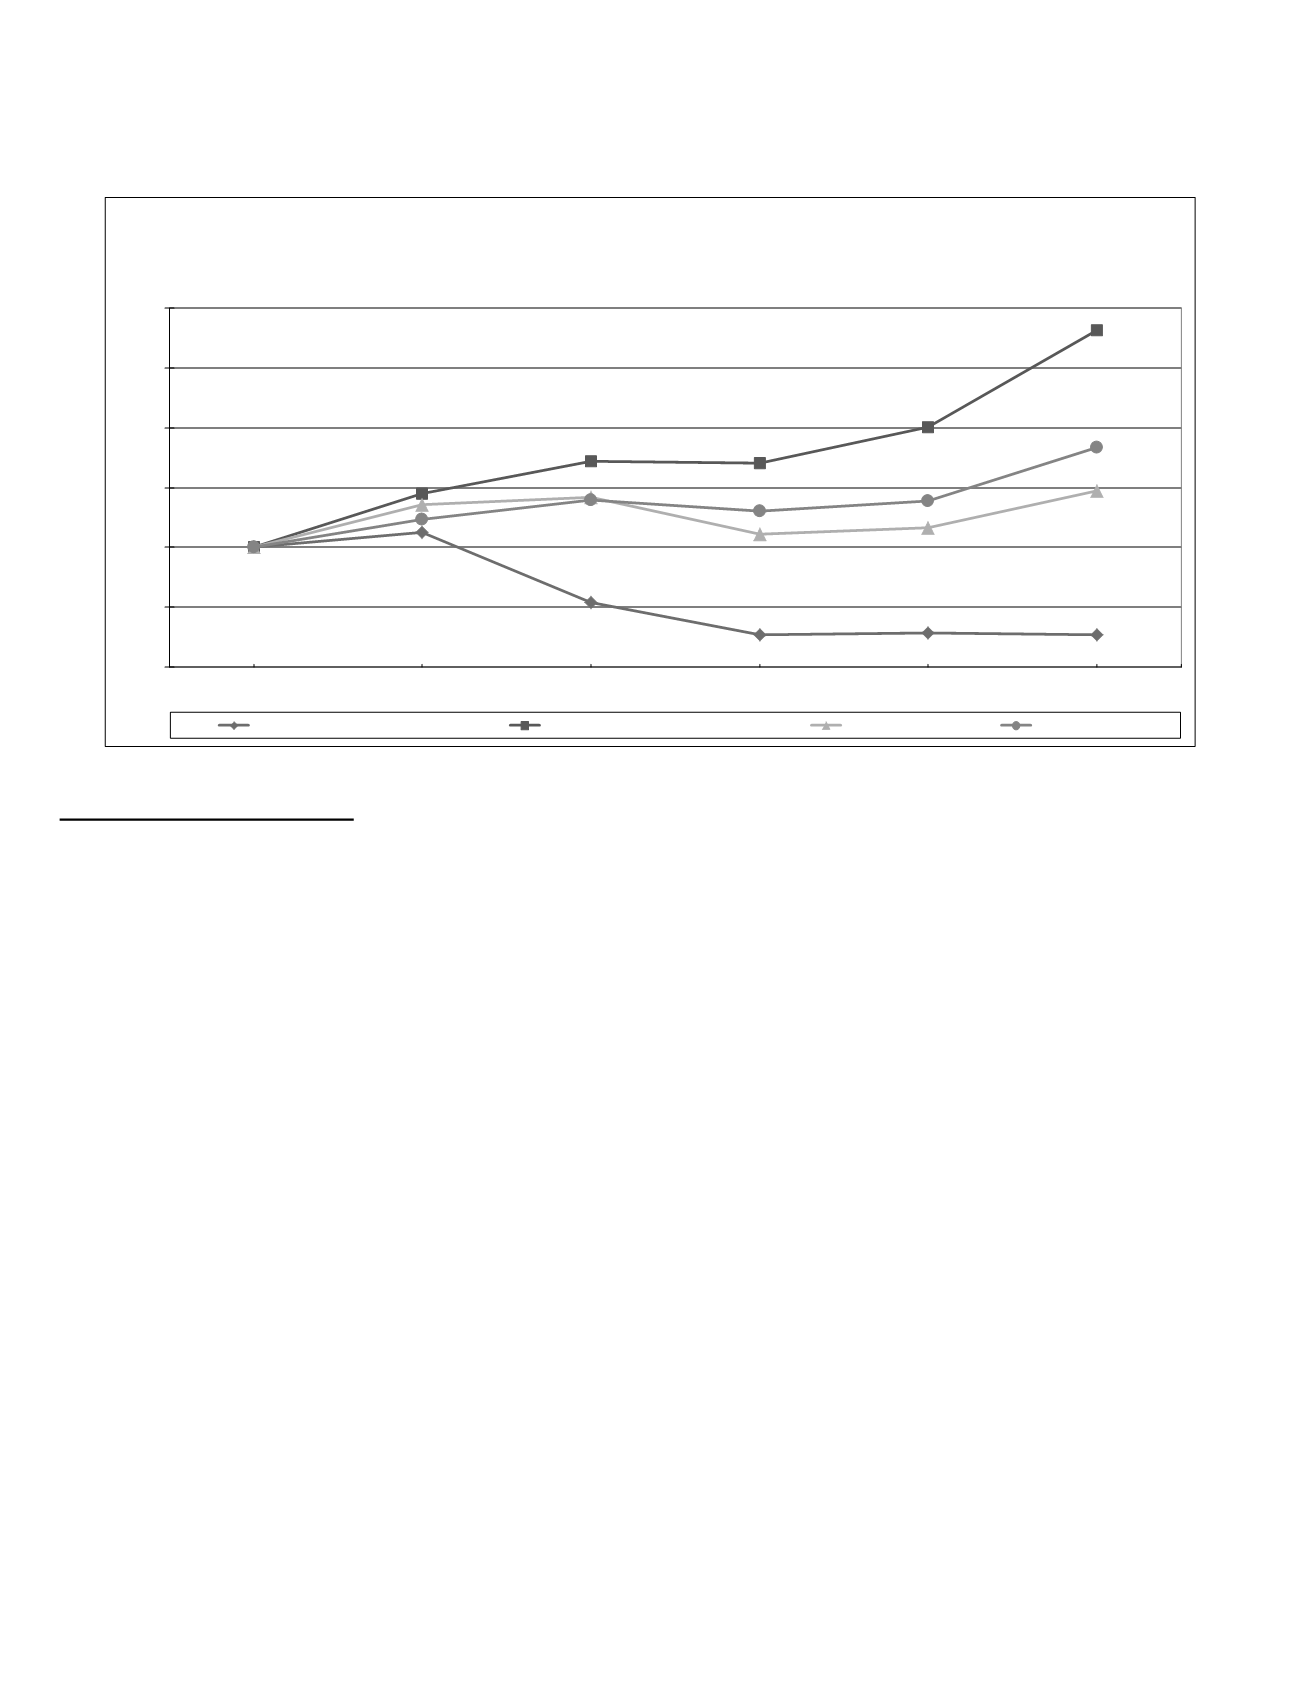
This performance graph shall not be deemed “filed” for purposes of Section 18 of the Exchange Act, or incorporated by
reference into any filing of the Company under the Securities Act or the Exchange Act, except as shall be expressly set forth by
specific reference in such filing. The stock price performance shown on the graph below is not necessarily indicative of future price
performance.
0.00
50.00
100.00
150.00
200.00
250.00
300.00
2008
2009
2010
2011
2012
2013
Comparison of 5 Year Cumulative Total Return
Assumes Initial Investment of $100
December 2013
TeleCommunication Systems Inc.
NASDAQ Composite-Total Returns
New Peer Group
Old Peer Group
Item 6.
Selected Financial Data
The table that follows presents portions of our consolidated financial statements. You should read the following selected
financial data together with our audited Consolidated Financial Statements and related notes and with “Management’s Discussion and
Analysis of Financial Condition and Results of Operations” and the more complete financial information included elsewhere in this
Form 10-K. We have derived the statements of operations data for the years ended December 31, 2013, 2012, and 2011 and the
balance sheet data as of December 31, 2013 and 2012 from our consolidated financial statements which have been audited by Ernst &
Young LLP, independent registered public accounting firm, and which are included in Item 15 of this Form 10-K. We have derived
the statements of operations data for the years ended December 31, 2010 and 2009 and the balance sheet data as of December 31,
2011, 2010, and 2009, from our audited financial statements which are not included in this Form 10-K. The historical results presented
below are not necessarily indicative of the results to be expected for any future fiscal year. See “Management’s Discussion and
Analysis of Financial Condition and Results of Operations.”


