Other considerations
Cascade to senior management
The principles of the policy are cascaded, where appropriate, to the other members of the Executive Committee as set out below.
| Cascade of policy to Executive Committee – 2009 financial year | |
|---|---|
| Total remuneration and base salary | Methodology consistent with the Main Board. |
| Annual bonus | The annual bonus is based on the same measures. However, in some circumstances these are across a business area rather than across the whole Group. |
| Long term incentive | Policy consistent with the Main Board. |
Dilution
All awards are made under plans that incorporate dilution limits as set out in the Guidelines for Share Incentive Schemes published by the Association of British Insurers. The current estimated dilution from subsisting awards, including executive and all-employee share awards, is approximately 3.0% of the Company’s share capital at 31 March 2008 (2.9% at 31 March 2007).
Funding
A mixture of newly issued shares, treasury shares and shares purchased in the market by the employee benefit trust is used to satisfy share-based awards. This policy is kept under review.
Other matters
The Share Incentive Plan and the DSB include restrictions on the transfer of shares while the shares are subject to the plan. Where, under an employee share plan operated by the Company, participants are the beneficial owners of the shares, but not the registered owner, the voting rights are normally exercised by the registered owner at the discretion of the participant.
All of the Company’s share plans contain provisions relating to a change of control. Outstanding awards and options would normally vest and become exercisable on a change of control, subject to the satisfaction of any performance conditions at that time.
TSR performance (audited information)
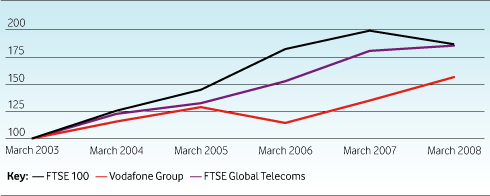
The following chart shows the performance of the Company relative to the FTSE100 index.

Five year historical TSR performance growth in the value of a hypothetical £100 holding over five years. FTSE 100 and FTSE Global Telecoms comparison based on spot values
Graph provided by Towers Perrin and calculated according to a methodology that is compliant with the requirements of Schedule 7A of the Companies Act of 1985. Data Sources: FTSE and Datastream.
Note: Performance of the Company shown by the graph is not indicative of vesting levels under the Company’s various incentive plans.
