| (in thousands, except for per share, ratios and performance data) | 2013 | 2012 | % Change |
|---|---|---|---|
| Operating Results | |||
| Sales and merchandising revenues | $ 5,604,574 | $ 5,272,010 | 6.3% |
| Gross profit | 365,225 | 358,005 | 2.0% |
| Equity in earnings of affiliates | 68,705 | 16,487 | 316.7% |
| Other income, net | 14,876 | 14,725 | 1.0% |
| Net Income | 95,702 | 75,565 | 26.6% |
| Net income attributable to The Andersons, Inc. | 89,939 | 79,480 | 13.2% |
| Financial Position | |||
| Total assets | 2,273,556 | 2,182,304 | 4.2% |
| Working capital | 229,451 | 304,346 | (24.6%) |
| Long-term debt | 371,150 | 407,176 | (8.9%) |
| Long-term debt, non-recourse | 4,063 | 20,067 | (79.8%) |
| Total equity | 724,421 | 611,445 | 18.5% |
| Per Share Data* | |||
| Net income—basic | 3.20 | 2.85 | 12.3% |
| Net income—diluted | 3.18 | 2.82 | 12.8% |
| Dividends paid | 0.43 | 0.40 | 7.5% |
| Year-end market value | 59.45 | 28.60 | 107.9% |
| Ratios and Other Data | |||
| Pretax return on beginning equity
attributable to The Andersons, Inc. | 25.2 % | 22.9 % | 10.0% |
| Net income attributable to The Andersons, Inc. return
on beginning equity attributable to The Andersons, Inc. | 15.1 % | 15.2 % | (0.7%) |
| Funded long-term debt to equity | 0.5–to–1 | 0.7–to–1 | (28.6%) |
| Weighted average shares outstanding (basic) | 27,986 | 27,784 | 0.7% |
| Effective tax rate | 36.0 % | 37.1 % | (3.0%) |
Net Income Attributable
to The Andersons, Inc.
(Dollars in Millions)
EBITDA
(Dollars in Millions)
Earnings Per
Share—Diluted*
(In Dollars)
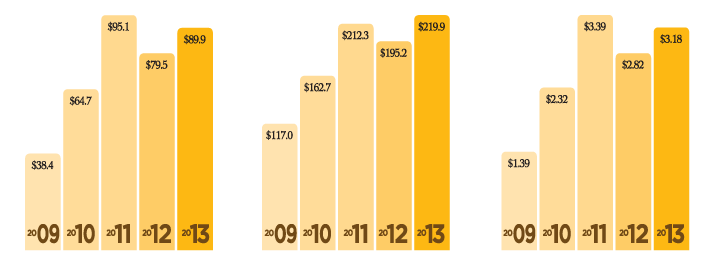
*Adjusted for 3-for-2 stock split, effective February 2014