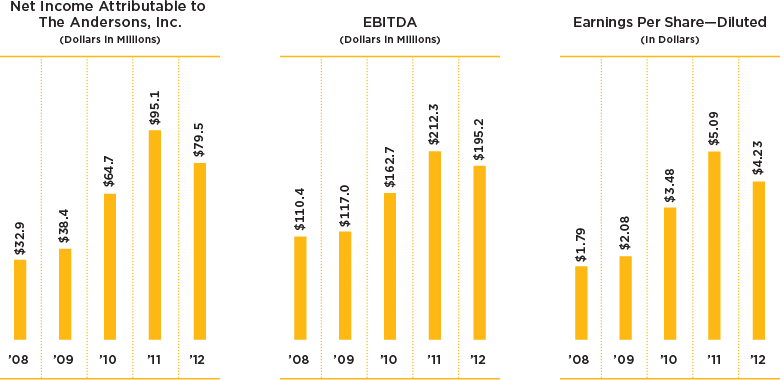
Financial Highlights
(in thousands, except for per share, ratios, and performance data) |
2012 | 2011 | % Change | ||
| Operating Results | |||||
| Sales and merchandising revenues | $5,272,010 | $4,576,331 | 15.2% |
||
| Gross profit | 358,005 | 352,852 | 1.5% |
||
| Equity in earnings of affiliates | 16,487 | 41,450 | (60.2%) |
||
| Other income, net | 14,725 | 7,922 | 85.9% |
||
| Net income | 75,565 | 96,825 | (22.0%) |
||
| Net income attributable to The Andersons, Inc. | 79,480 | 95,106 | (16.4%) |
||
| Financial Position | |||||
| Total assets | 2,182,304 | 1,734,123 | 25.8% |
||
| Working capital | 304,346 | 312,971 | (2.8%) |
||
| Long-term debt | 407,176 | 238,088 | 71.0% |
||
| Long-term debt, non-recourse | 20,067 | 797 | 2,417.8% |
||
| Total equity | 611,445 | 538,842 | 13.5% |
||
| Per Share Data | |||||
| Net income—basic | 4.27 | 5.13 | (16.8%) |
||
| Net income—diluted | 4.23 | 5.09 | (16.9%) |
||
| Dividends paid | 0.60 | 0.44 | 36.4% |
||
| Year end market value | 42.90 | 43.66 | (1.7%) |
||
| Ratios and Other Data | |||||
| Pretax return on beginning equity attributable to The Andersons, Inc. | 22.9% |
32.8% |
(30.0%) |
||
| Net income attributable to The Andersons, Inc. return on beginning equity attributable to The Andersons, Inc. | 15.2% |
21.1% |
(28.0%) |
||
| Funded long-term debt to equity | 0.7-to-1 |
0.4-to-1 |
75.0% |
||
| Weighted average shares outstanding (basic) | 18,523 | 18,457 | 0.4% |
||
| Effective tax rate | 37.1% |
34.5% |
7.5% |


