FINANCIAL HIGHLIGHTS
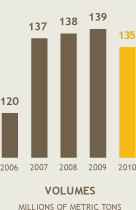
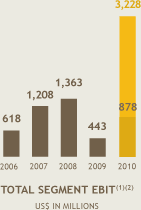
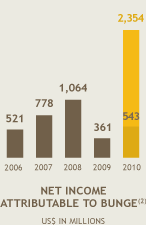
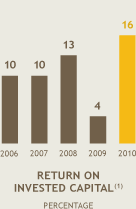
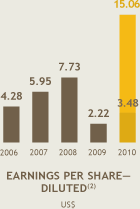
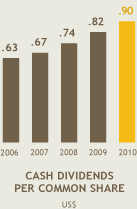
(1) Total segment earnings before interest and tax ("EBIT") and return on invested capital ("ROIC") are non-GAAP financial measures. A reconciliation to the most directly comparable U.S. GAAP financial measures is presented below.
(2) 2010 Total Segment EBIT of $878 million, Net Income Attributable to Bunge of $543 million and $3.48 of Earnings Per Share-Diluted exclude approximately $2.4 billion pre-tax and approximately $1.9 billion after-tax gains on the sale of the Brazilian fertilizer nutrients assets and a $90 million loss on extinguishment of debt.
TOTAL SEGMENT EBIT RECONCILIATION
| YEAR ENDED DECEMBER 31, | |||||
| (US$ in millions) | 2006 | 2007 | 2008 | 2009 | 2010 |
| Total segment EBIT | $618 | $1,208 | $1,363 | $443 | $3,228 |
| Interest-net | (161) | (187) | (147) | (161) | (229) |
| Income tax benefit (expense) | 36 | (310) | (245) | 110 | (689) |
| Noncontrolling interest share of interest and tax | 28 | 67 | 93 | (31) | 44 |
| Net income attributable to Bunge | $521 | $778 | $1,064 | $361 | $2,354 |
ROIC RECONCILIATION
| YEAR ENDED DECEMBER 31, | |||||
| (US$ in millions) | 2006 | 2007 | 2008 | 2009 | 2010 |
| Net income attributable to Bunge | $521 | $778 | $1,064 | $361 | $2,354 |
| Add back/subtract: | |||||
| Noncontrolling interest | 60 | 146 | 262 | (26) | 34 |
| Income tax (benefit) expense | (36) | 310 | 245 | (110) | 689 |
| Interest expense | 280 | 353 | 361 | 283 | 298 |
| $825 | $1,587 | $1,932 | $508 | $3,375 | |
| Tax rate | —% | 26% | 16% | —% | 23% |
| Return | $825 | $1,174 | $1,623 | $508 | $2,599 |
|
Average total |
$8,630 | $11,403 | $12,478 | $12,946 | $15,808 |
| ROIC | 10% | 10% | 13% | 4% | 16% |
|
(a) Average is calculated using balances of total equity plus total debt at the beginning of the year and at the end of the year.
|
|||||
