 |
|
 |
|
|
| Operating
Results (millions) |
 |
2001
|
   |
2000**
|
Change
|
 |
 |
|
 |
|
|
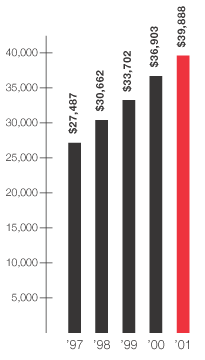
Revenues |
 |
$ 39,888
|
  |
 $ 36,903 $ 36,903 |
 8% 8% |
 |
 |
|
 |
|
|
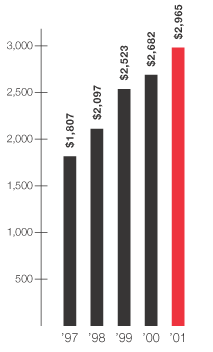
| Pre-tax
segment profit |
 |
$ 2,965
|
  |
$ 2,682
|
11%
|
 |
 |
|
 |
|
|
|
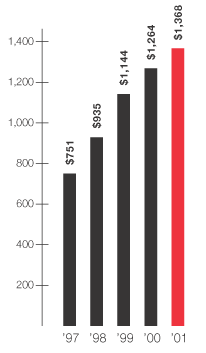
Net
earnings*
|
|
$ 1,368
|
|
$ 1,264
|
8%
|
 |
 |
|
 |
|
|
|
 |
|
  |
|
|
 |
 |
|
 |
|
|
| Per
Share Data |
 |
|
  |
|
|
 |
 |
|
 |
|
|
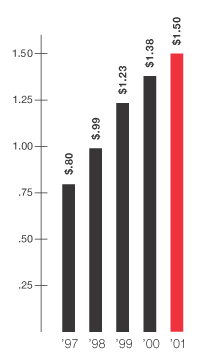
Diluted earnings* |
 |
$ 1.50
|
  |
$ 1.38
|
9%
|
 |
 |
|
 |
|
|
| Cash
dividends declared |
 |
$ .225
|
  |
$ .215
|
5%
|
 |
 |
|
 |
|
|
|
 |
|
  |
|
|
 |
 |
|
 |
|
|
|
At
Year-end
(thousands,
except Number of stores)
|
 |
|
  |
|
|
 |
 |
|
 |
|
|
Common shares outstanding |
 |
905,165
|
  |
897,763
|
|
 |
 |
|
 |
|
|
| Retail
square feet |
 |
161,266
|
  |
149,078
|
|
 |
 |
|
 |
|
|
|
Number
of stores
|
|
1,381
|
|
1,307
|
|
 |
 |
|
 |
|
|
*Includes unusual items, resulting in net after-tax
charges and impacts to earnings per share of $48 million and
$.06 per share in 2001, $44 million and $.04 per share in 1999,
$35 million and $.04 per share in 1998 and $24 million and $.02
per share in 1997.
**53-week year.
|
| |
 |

 |
|
|
| |
Pre-tax
Segment Profit (millions) |
|
|
|
|
 |
 |
|
|
| |
Diluted
Earnings per Share* |
|
|
|
| |
|
|
 |
|
 |
 |
 |
 |
 |
|
 |
 |
 |
 |
 |
The 2001
Target Corporation Annual Report is also available for download
in Adobe's PDF format. You will need to have Adobe Acrobat
Reader installed on your computer to read this version of
the Annual Report. You can click
here to get more information from Adobe, or if you are
ready to download the Annual Report, click
here to begin.
contact
us • terms & conditions
• privacy • ©2002
Target Corporation. All rights reserved
|
|
 |
 |
 |
|
|