Eleven-Year Financial Summary

Dollars and shares in thousands except per share amounts  

Income:

 
Operating revenues $
Operating income $
Income from continuing operations before income taxes $
Income taxes $
Income from continuing operations $
Income (loss) from discontinued operations (net of tax) $
Cumulative effect of changes in accounting principles (net of tax) $
Net income $
Net income per common share - assuming dilution:  
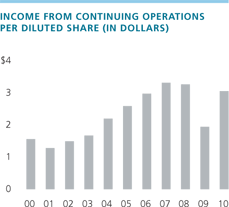
Income from continuing operations $
Income (loss) from discontinued operations $
Cumulative effect of changes in accounting principle $
Net income $
   

Financial Position:

 
Net working capital $
Net plant and equipment $
Total assets $
Long-term debt $
Total debt $
Total Invested capital $
Stockholders’ equity $
   

Cash Flow:

 
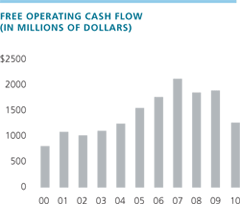
Free operating cash flow $
Cash dividends paid $
Dividends paid per share $
Dividends declared per share $
Plant and equipment additions $
Depreciation $
Amortization and impairment of goodwill and other intangible assets $
   

Financial Ratios:

 
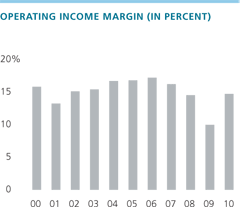
Operating income margin %
Return on average stockholders’ equity %
Return on average invested capital %
Book value per share $
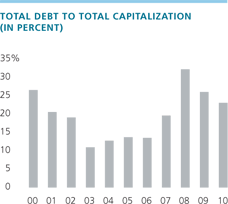
Total debt to total capitalization %
   

Other Data:

 
Market price per share at year-end $
Shares outstanding at December 31  
Weighted average shares outstanding  
Research and development expenses $
Employees at December 31  
Number of acquisitions  
Cash paid for acquisitions $
2010 2009
   
15,870,376 13,877,068
2,356,678 1,385,979
2,211,993 1,213,790
684,800 244,300
1,527,193 969,490
- (22,481)
- -
1,527,193 947,009
   
3.03 1.93
- (0.04)
- -
3.03 1.89
   
   
2,874,809 2,838,957
2,023,045 2,136,527
16,250,273 16,081,984
2,511,959 2,914,874
2,829,746 3,128,555
11,020,954 10,627,659
9,318,246 8,817,876
   
   
1,274,618 1,899,487
636,200 619,681
1.270 1.240
1.300 1.240
286,172 247,102
334,388 366,127
213,890 308,798
   
   
14.8 10.0
16.8 11.8
15.3 10.7
18.85 17.55
23.2 26.2
   
   
53.40 47.99
497,744 502,336
500,772 500,177
220,462 198,536
61,000 59,000
24 20
433,403 281,674
2008 2007
   
17,100,341 16,110,267
2,501,286 2,627,766
2,351,538 2,583,940
660,445 756,249
1,691,093 1,827,691
(172,090) 42,171
- -
1,519,003 1,869,862
   
3.24 3.29
(0.33) 0.08
- -
2.91 3.36
   
   
928,886 3,205,370
2,109,432 2,194,010
15,203,551 15,525,862
1,247,883 1,888,839
3,681,856 2,299,351
10,613,997 10,830,058
7,675,091 9,358,231
   
   
1,859,912 2,130,942
598,690 502,430
1.150 0.910
1.180 0.980
362,312 353,355
367,615 363,701
324,292 161,043
   
   
14.6 16.3
19.9 19.9
16.0 18.0
15.38 17.65
32.4 19.7
   
   
35.05 53.54
499,115 530,097
518,609 551,549
212,658 197,595
65,000 60,000
50 52
1,546,982 812,757
2006 2005
   
13,788,346 12,540,360
2,385,391 2,115,230
2,390,975 2,156,241
710,424 675,806
1,680,551 1,480,435
37,195 14,434
- -
1,717,746 1,494,869
   
2.95 2.57
0.07 0.03
- -
3.01 2.60
   
   
2,569,821 2,110,874
2,053,457 1,807,109
13,880,439 11,445,643
955,610 958,321
1,418,331 1,211,220
9,849,356 8,392,897
9,021,232 7,552,094
   
   
1,765,022 1,558,441
398,846 335,092
0.705 0.585
0.750 0.610
301,006 293,102
319,362 299,232
124,544 83,842
   
   
17.3 16.9
20.3 19.5
18.3 17.6
16.15 13.45
13.6 13.8
   
   
46.19 44.00
558,750 561,627
565,632 571,058
145,438 126,305
55,000 50,000
53 22
1,378,708 626,922
2004 2003
   
11,336,102 9,662,593
1,905,517 1,493,323
1,980,239 1,556,093
650,101 529,697
1,330,138 1,026,396
8,556 (2,716)
- -
1,338,694 1,023,680
   
2.18 1.66
0.01 (0.00)
- -
2.20 1.66
   
   
2,471,227 3,294,299
1,876,875 1,728,638
11,351,934 11,193,321
921,098 920,360
1,124,621 976,454
8,089,817 7,190,735
7,632,586 7,898,764
   
   
1,254,237 1,110,429
304,581 285,399
0.500 0.465
0.520 0.470
282,560 258,312
294,162 282,277
59,121 24,276
   
   
16.8 15.5
17.1 14.1
16.8 13.7
13.06 12.80
12.8 11.0
   
   
46.34 41.96
584,457 617,273
604,752 614,138
121,655 104,967
49,000 47,500
24 28
587,783 203,726
2002 2001
   
9,063,231 8,911,243
1,379,970 1,187,687
1,407,003 1,196,687
493,042 416,688
913,961 779,999
20,522 25,660
(221,891) -
712,592 805,659
   
1.48 1.27
0.03 0.04
(0.36) -
1.16 1.32
   
   
2,276,401 1,587,332
1,631,249 1,633,690
10,623,101 9,822,349
1,460,381 1,267,141
1,581,985 1,580,588
7,183,372 7,354,877
6,659,074 6,056,513
   
   
1,017,332 1,094,464
272,319 249,141
0.445 0.410
0.450 0.420
271,424 256,562
277,819 281,723
27,933 104,585
   
   
15.2 13.3
14.4 13.6
12.3 10.6
10.86 9.93
19.2 20.7
   
   
32.43 33.86
613,166 609,853
612,313 608,224
99,061 100,311
48,700 52,000
21 29
188,234 556,199
2000  
   
9,153,777  
1,454,594  
1,460,081  
513,736  
946,345  
11,635  
-  
957,980  
   
1.55  
0.02  
-  
1.57  
 
 
1,511,451  
1,629,883  
9,514,847  
1,549,038  
1,974,827  
7,254,860  
5,431,328  
 
 
809,617  
223,009  
0.370  
0.380  
305,954  
272,660  
118,905  
   
   
15.9  
18.4  
13.7  
8.98  
26.7  
   
   
29.78  
604,897  
603,147  
104,785  
55,300  
45  
798,838  


Note: Certain reclassifications of prior years’ data have been made to conform with current year reporting.
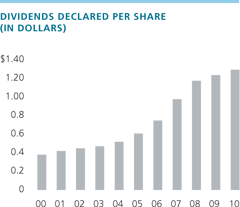
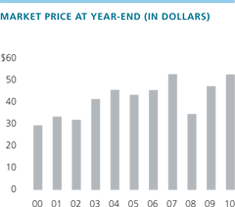
Dividends Declared Per ShareMarket Price at Year-End
Operating Income MarginIncome From Continuing Operations Per Diluted Share
Return on Average Stockholder's Equity Return on Average Invested Capital
Free Operating Cash Flow Total Debt to Total Capitalization