
MD&A
Quantitative and Qualitative Disclosures About Market Risk
Financial Statements
Notes to Financial Statements
Shareholder Return Performance Graph
Quarterly Financial Data
Selected Historical Financial Data
Non-GAAP Financial Measure Reconciliation
Management’s Reports
Reports of Independent Registered Public Accounting Firm
North American Full-Service Lodging includes Marriott Hotels & Resorts, JW Marriott, Renaissance Hotels, and Autograph Collection.
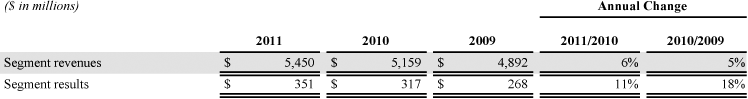
2011 Compared to 2010
In 2011, across our North American Full-Service Lodging segment we added 10 properties (4,178 rooms) and seven properties (1,925 rooms) left the system.
In 2011, RevPAR for comparable company-operated North American Full-Service properties increased by 5.0 percent to $115.72, occupancy for these properties increased by 1.1 percentage points to 70.7 percent, and average daily rates increased by 3.3 percent to $163.59.
The $34 million increase in segment results, compared to 2010, primarily reflected $26 million of higher management and franchise fees and $16 million of higher owned, leased, and other revenue net of direct expenses, partially offset by $5 million of higher general, administrative, and other expenses.
Higher base management and franchise fees primarily reflected increased RevPAR and unit growth, including properties added to the Autograph Collection.
The $16 million increase in owned, leased, and other revenue net of direct expenses is primarily due to $7 million of net stronger results driven by higher RevPAR and property-level margins, $7 million of termination fees for two properties, and a $3 million favorable variance associated with prior year losses associated with a leased property that now is operated under a management agreement.
The $5 million increase in general, administrative, and other expenses primarily reflected the following 2011 items: a $5 million performance cure payment for one property, a $2 million increase in the guarantee reserve for one property, and the write-off of contract acquisition costs totaling $2 million for two properties, partially offset by a favorable variance from the $4 million contract acquisition cost impairment charge recorded in 2010, further detailed in the “2010 Compared to 2009” discussion that follows.
Cost reimbursements revenue and expenses associated with our North American Full-Service Lodging segment properties totaled $4,862 million in 2011, compared to $4,587 million in 2010.
2010 Compared to 2009
In 2010, across our North American Full-Service Lodging segment we added 20 properties (7,591 rooms) and 5 properties (1,541 rooms) left the system.
In 2010, RevPAR for comparable company-operated North American Full-Service properties increased by 4.3 percent to $107.86, occupancy for these properties increased by 2.8 percentage points to 69.1 percent, and average daily rates increased by 0.1 percent to $156.14.
The $49 million increase in segment results, compared to 2009, primarily reflected $22 million of higher base management and franchise fees, $10 million of higher incentive management fees, $8 million of lower general, administrative, and other expenses, and $8 million of higher owned, leased, and other revenue net of direct expenses.
The $22 million of higher base management and franchise fees primarily reflected increased RevPAR and unit growth as well as franchise fees from new properties added to the Autograph Collection. The $10 million increase in incentive management fees was largely due to higher property-level revenue and continued tight property-level cost controls favorably impacting house profit margins.
The $8 million increase in owned, leased, and other revenue net of direct expenses is primarily due to stronger results driven by higher RevPAR and property-level margins.
The $8 million decrease in general, administrative, and other expenses primarily reflected favorable variances from an $8 million impairment charge related to the write-off of contract acquisition costs for one property, a $7 million charge for a security deposit, both of which we deemed unrecoverable in 2009, and a $3 million reversal of a completion guarantee accrual because we satisfied the related guarantee release requirements in 2010. These favorable variances were partially offset by $7 million in net 2010 other cost increases, primarily reflecting incentive compensation, as well as a $4 million contract acquisition cost impairment charge recorded in the 2010 fourth quarter because we expected that a management agreement associated with one property would be terminated early in 2011 in conjunction with a change in property ownership.
Cost reimbursements revenue and expenses associated with our North American Full-Service Lodging segment properties totaled $4,587 million in 2010, compared to $4,333 million in 2009.