
MD&A
Quantitative and Qualitative Disclosures About Market Risk
Financial Statements
Notes to Financial Statements
Shareholder Return Performance Graph
Quarterly Financial Data
Selected Historical Financial Data
Non-GAAP Financial Measure Reconciliation
Management’s Reports
Reports of Independent Registered Public Accounting Firm
Timeshare included Marriott Vacation Club, The Ritz-Carlton Destination Club and Residences, and Grand Residences by Marriott brands worldwide, prior to the spin-off. See Footnote No. 17, “Spin-off” of the Notes to our Financial Statements for additional information on the spin-off. The results for 2011 include the results of the former Timeshare segment prior to the spin-off date while results for 2010 and 2009 include the former Timeshare segment for those entire fiscal years.
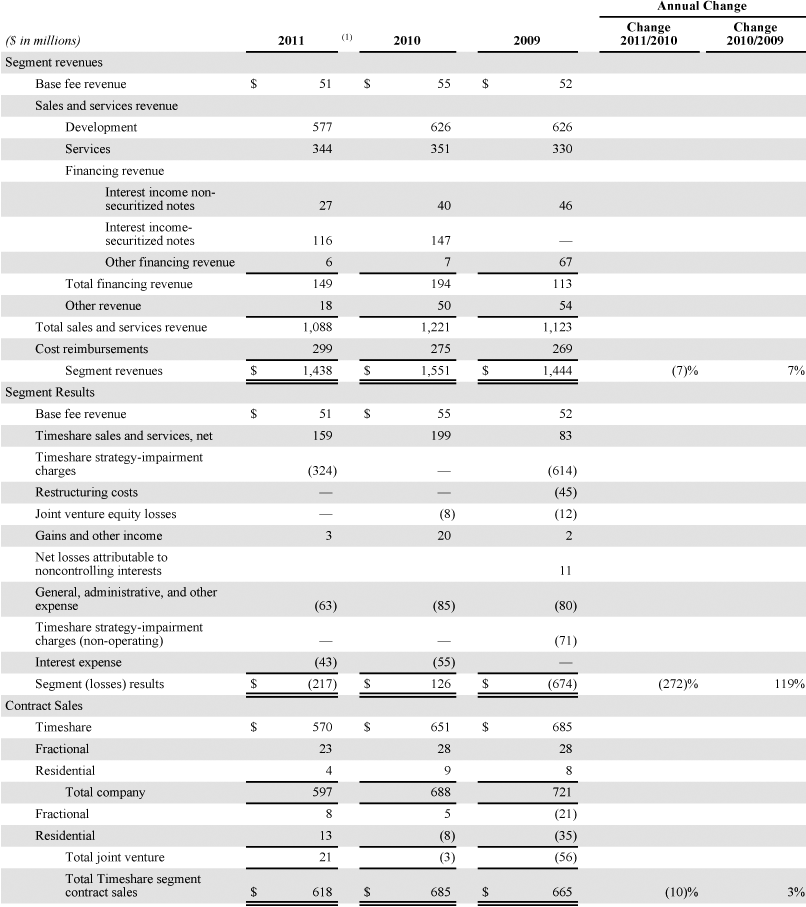
(1) 2011 Activity is prior to the date of spin-off, November 21, 2011.
2011 Compared to 2010
Timeshare segment contract sales decreased by $67 million to $618 million in 2011 from $685 million in 2010 primarily reflecting an $81 million decrease in timeshare contract sales and a $2 million decrease in fractional contract sales, partially offset by a $16 million increase in residential contract sales. Timeshare contract sales decreased in 2011 primarily as a result of the spin-off of the timeshare business resulting in fewer periods of Timeshare segment activity reflected in the 2011 fiscal year, as compared to a full fiscal year in 2010, as well as difficult comparisons driven by sales promotions in 2010 and the start-up impact of the shift from the sale of weeks-based to points-based products in the 2010 third quarter. Residential and fractional contract sales benefited from a net $19 million decrease in cancellation allowances that we recorded in 2010 in anticipation that a portion of contract revenue, previously recorded for certain residential and fractional projects would not be realized due to contract cancellations prior to closing.
The $113 million decrease in Timeshare segment revenues to $1,438 million from $1,551 million primarily reflected a $133 million decrease in Timeshare sales and services revenue and a $4 million decrease in base management fees, partially offset by a $24 million increase in cost reimbursements revenue. The decrease in Timeshare sales and services revenue primarily reflected: (1) $49 million of lower development revenue which reflected the spin-off and, to a lesser extent, lower sales volumes, partially offset by favorable reportability primarily related to sales reserves recorded in 2010; (2) $45 million of lower financing revenue from lower interest income as a result of the transfer of the mortgage portfolio to MVW in conjunction with the spin-off as well as a lower mortgage portfolio balance prior to the spin-off date; (3) $32 million of lower other revenue which primarily reflected the spin-off and lower resales revenue; and (4) $7 million of lower services revenue which reflected the spin-off, partially offset by increased rental occupancies and rates.
Segment results decreased by $343 million to segment losses of $217 million in 2011 from segment income of $126 million in 2010, and primarily reflected $324 million of Timeshare strategy-impairment charges, $40 million of lower Timeshare sales and services revenue net of direct expenses, $17 million of lower gains and other income, and $4 million of lower base management fees, partially offset by $22 million of lower general, administrative, and other expense, $12 million of lower interest expense, and $8 million of lower joint venture equity losses.
The $40 million decrease in Timeshare sales and services revenue net of direct expenses primarily reflected $28 million of lower other revenue, net of expenses and $25 million of lower financing revenue, net of expenses, partially offset by $8 million of higher development revenue net of product costs and marketing and selling costs and $5 million of higher services revenue, net of expenses. The $28 million decrease in other revenue, net of expenses primarily reflected a $15 million unfavorable variance from an adjustment to the Marriott Rewards liability in the prior year and, to a lesser extent the impact of the spin-off in 2011 as well as lower resales revenue, net of expenses due to lower closings. The $25 million decrease in financing revenue, net of expenses primarily reflected decreased interest income due to the spin-off as well as lower notes receivable balances. Higher development revenue net of product costs and marketing and selling costs primarily reflected favorable reportability as well as a favorable variance from a net $12 million reserve in the prior year, partially offset by lower 2011 sales volumes as well as the impact of the spin-off.
Gains and other income decreased by $17 million and primarily reflected the sale of one property for a gain in 2010 and smaller gains on sales of property in 2011. Base management fees decreased by $4 million, primarily due to the spin-off.
General, administrative, and other expense decreased by $22 million primarily due to a $13 million impairment charge in 2010 associated with the disposition of a golf course and related assets as well as the impact of the spin-off. For additional information on the impairment charge recorded in 2010, see Footnote No. 7, “Property and Equipment,” of the Notes to our Financial Statements.
Joint venture equity losses decreased by $8 million and primarily reflected lower losses from a residential and fractional project joint venture for which the former Timeshare segment stopped recognizing their portion of the losses since their investment, including loans due from the joint venture, was reduced to zero in 2010.
The $12 million decrease in interest expense was a result of the transfer of the outstanding debt obligations associated with securitized notes receivable to MVW in conjunction with the spin-off, as well as lower outstanding debt obligations and lower interest rates.
2010 Compared to 2009
During the 2010 third quarter, we launched the points-based Marriott Vacation Club Destinations timeshare program (the “MVCD Program”) in North America and the Caribbean. Under the MVCD Program, we sold beneficial interests in a domestic land trust. Based on the number of beneficial interests purchased, MVCD members received an annual allocation of Vacation Club Points to redeem for travel at numerous destinations. Although the rights and privileges, that existed at the launch of the new program for owners of weeks-based intervals were unchanged, those owners also had the option of enrolling in the MVCD Program, which afforded them the opportunity to trade their weeks-based intervals for Vacation Club Points usage each year, as well as to purchase additional product in increments of less than one week. Since the MVCD Program was a significant change from our prior approach to the timeshare business, marketing efforts initially focused on existing owners, to encourage participation and purchase of additional product.
Timeshare segment contract sales, including sales made by our timeshare joint venture projects, represent sales of timeshare interval, fractional ownership, and residential ownership products before the adjustment for percentage-of-completion accounting. Timeshare segment contract sales increased by $20 million to $685 million in 2010 from $665 million in 2009 primarily reflecting a $28 million increase in residential contract sales and a $26 million increase in fractional contract sales, mostly offset by a $34 million decrease in timeshare contract sales. Sales of timeshare intervals were hurt by tough comparisons driven by sales promotions begun in 2009. Residential and fractional contract sales benefited from a net $63 million decrease in cancellation allowances we recorded in anticipation that a portion of contract revenue previously recorded for certain residential and fractional projects would not be realized due to contract cancellations prior to closing.
The $107 million increase in Timeshare segment revenues to $1,551 million from $1,444 million in 2009 primarily reflected a $98 million increase in Timeshare sales and services revenue, a $6 million increase in cost reimbursements revenue, and a $3 million increase in base management fees. The increase in Timeshare sales and services revenue, compared to 2009, primarily reflected higher financing revenue due to higher interest income associated with the impact of the new Transfers of Financial Assets and Consolidation standards and, to a lesser extent, higher services revenue reflecting increased rental occupancies and rates. These favorable impacts were partially offset by lower development revenue reflecting lower sales volumes primarily due to tough comparisons driven by sales promotions begun in 2009, and a $20 million increase in reserves (we began reserving for 100 percent of notes that were in default in addition to the reserve we recorded on notes not in default).
Segment income of $126 million in 2010 increased by $800 million from $674 million of segment losses in 2009, and primarily reflected a favorable variance from the $685 million of impairments recorded in 2009, $116 million of higher 2010 Timeshare sales and services revenue net of direct expenses, $45 million of lower restructuring costs compared with 2009, $18 million increase in gains and other income, $3 million increase in base management fees, and $4 million of lower joint venture equity losses partially offset by a $55 million increase in interest expense, an $11 million decrease in net losses attributable to noncontrolling interest, and $5 million of higher general, administrative, and other expenses.
The $116 million increase in Timeshare sales and services revenue net of direct expenses primarily reflected $78 million of higher financing revenue, net of expenses, $33 million of higher development revenue net of product costs and marketing and selling costs, and $8 million of higher other revenue net of expense, partially offset by $3 million of lower services revenue net of expenses. Higher development revenue net of product costs and marketing and selling costs primarily reflected both lower costs due to lower sales volumes and lower marketing and selling costs in 2010, as well as favorable variances from both a $10 million charge related to an issue with a state tax authority and a net $3 million impact from contract cancellation allowances in 2009, partially offset by lower development revenue for the reasons stated previously. The $20 million unfavorable impact to development revenue related to the reserve for uncollectible accounts was partially offset by a favorable impact in product costs, resulting in a net $12 million increase in reserves.
The $78 million increase in financing revenue, net of expense, primarily reflected: (1) a net $141 million increase in interest income, reflecting a $147 million increase from the notes receivable we consolidated in 2010 associated with past securitization transactions as part of our adoption of the new Transfers of Financial Assets and Consolidation standards, partially offset by a $6 million decrease in interest income related to non-securitized notes receivable reflecting a lower outstanding balance; and (2) a favorable variance from a $20 million charge in 2009 related to the reduction in the valuation of residual interests. These favorable variances were partially offset by $42 million of decreased residual interest accretion reflecting the elimination of residual interests as part of our 2010 adoption of the new Transfers of Financial Assets and Consolidation standards, $37 million of gain on notes sold in 2009, and $3 million of other net expenses.
The $8 million increase in other revenue net of expense primarily reflected a $15 million favorable adjustment to the Marriott Rewards liability resulting from lower than anticipated cost of redemptions, as well as $6 million of higher other miscellaneous revenue, partially offset by $13 million of net costs in excess of enrollment revenue related to the MVCD Program. The $11 million increase in services revenue net of expenses primarily reflected higher rental revenue associated with increased transient demand.
The $55 million in interest expense was a result of the consolidation of debt obligations due to our adoption of the new Transfers of Financial Assets and Consolidation standards.
Gains and other income increased by $18 million, primarily due to the sale of one property in the 2010 fourth quarter.
The $5 million increase in general, administrative, and other expenses primarily reflected a $13 million impairment charge in 2010 associated with the anticipated disposition of a golf course and related assets. Partially offsetting this unfavorable variance was a $7 million write-off of capitalized software development costs in 2009 related to a project for which we decided not to pursue further development.
Joint venture equity losses decreased by $4 million and primarily reflected higher cancellation allowances recorded at a joint venture in 2009.
The $11 million decrease to zero in net losses attributable to a noncontrolling interest was associated with our acquisition of that noncontrolling interest.