
MD&A
Quantitative and Qualitative Disclosures About Market Risk
Financial Statements
Notes to Financial Statements
Shareholder Return Performance Graph
Quarterly Financial Data
Selected Historical Financial Data
Non-GAAP Financial Measure Reconciliation
Management’s Reports
Reports of Independent Registered Public Accounting Firm
5. EARNINGS PER SHARE
The table below illustrates the reconciliation of the earnings (losses) and number of shares used in our calculations of basic and diluted earnings (losses) per share attributable to Marriott shareholders.
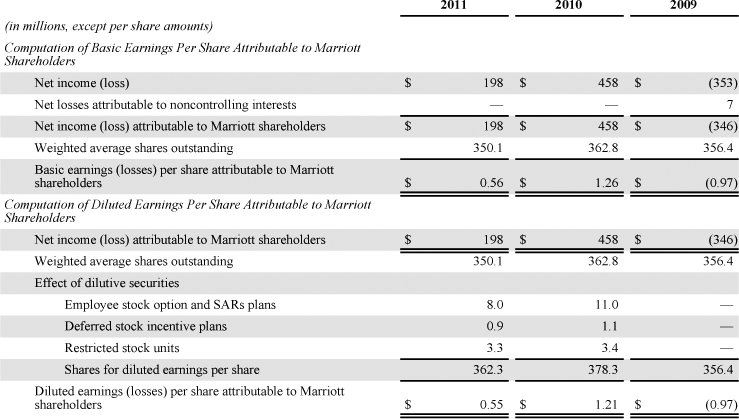
We compute the effect of dilutive securities using the treasury stock method and average market prices during the period. We determine dilution based on earnings. As we recorded a loss in 2009, we did not include the following shares in the “Effect of dilutive securities” caption in the preceding table, because it would have been antidilutive to do so: 7.5 million employee stock option and SARs plan shares, 1.4 million deferred stock incentive plans shares, and 2.1 million RSU shares.
In accordance with the applicable accounting guidance for calculating earnings per share, we have not included the following stock options and SARs in our calculation of diluted earnings per share because the exercise prices were greater than the average market prices for the applicable periods:
(a) for 2011, 4.1 million options and SARs, with exercise prices ranging from $30.31 to $46.21;
(b) for 2010, 2.4 million options and SARs, with exercise prices ranging from $34.11 to $49.03; and
(c) for 2009, 12.3 million options and SARs, with exercise prices ranging from $22.30 to $49.03.