MD&A
Quantitative and Qualitative Disclosures About Market Risk
Financial Statements
Notes to Financial Statements
Shareholder Return Performance Graph
Quarterly Financial Data
Selected Historical Financial Data
Non-GAAP Financial Measure Reconciliation
Management’s Reports
Reports of Independent Registered Public Accounting Firm
22. RELATED PARTY TRANSACTIONS
Equity Method Investments
We have equity method investments in entities that own properties for which we provide management and/or franchise services and receive fees. In addition, in some cases we provide loans, preferred equity or guarantees to these entities. We generally own between 10 and 49 percent of these equity method investments. Undistributed earnings attributable to our equity method investments represented approximately $4 million of our consolidated retained earnings at year-end 2011.
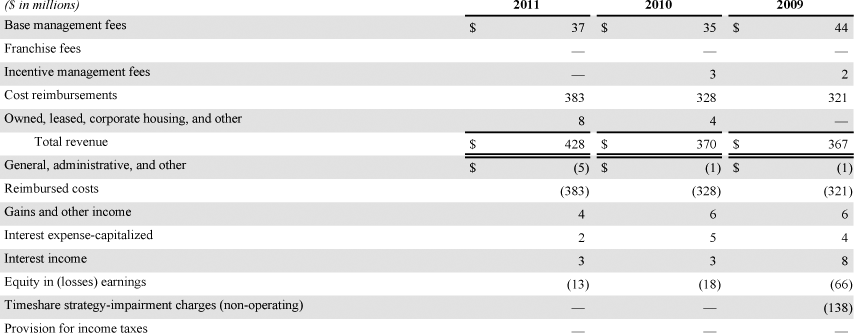
The following tables present financial data resulting from transactions with these related parties:
Income Statement Data

Balance Sheet Data

Summarized information for the entities in which we have equity method investments is as follows:
Income Statement Data

Balance Sheet Summary

