The following charts reflect results from continuing operations. Revenues Revenues Diluted EPS Diluted EPS Operating Profit Operating Profit Free Cash Flow Free Cash Flow Revenues ($ in billions) $1.96 2007 $2.03 2008 $1.66 2009 $1.63 2010 $1.80 2011 Diluted EPS $2.89 2007 $3.51 2008 $2.01 2009 $1.79 2010 $2.42 2011 Operating Profit ($ in millions) Margins $22211.3% 2007 $26112.9% 2008 $1549.3% 2009 $1589.7% 2010 $18910.5% 2011 Free Cash Flow ($ in millions) $177 2007 $195 2008 $72 2009 $139 2010 $138 2011 Free Cash Flow is defined as cash provided by operating activities minus purchases of property, plant, and equipment.
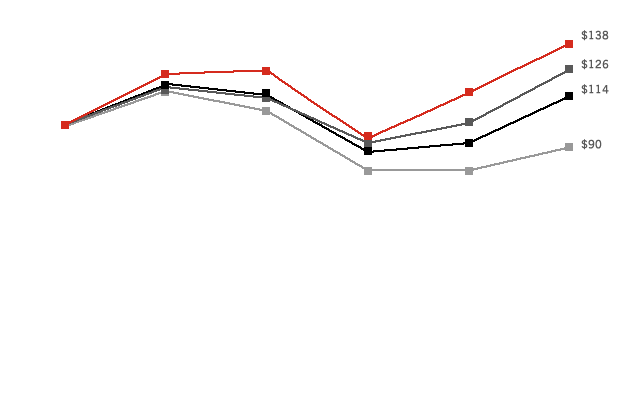
Comparison of Five-Year Cumulative Total Return (Based upon an initial investment on August 31, 2006 with dividends reinvested.)
10-K Click to download. Section Page(s) Format & Size Entire Form 10-K 1–107 PDF, 2.2 MB Cover Page 1–2 PDF, 532 KB Part I 4–14 PDF, 568 KB Part II 14–78 PDF, 768 KB Part III 78–79 PDF, 532 KB Part IV 80–87 PDF, 544 KB Signatures 88 PDF, 532 KB Schedule II 89 PDF, 532 KB Exhibit 12 90 PDF, 528 KB Exhibit 21 91 PDF, 528 KB Exhibit 23 92 PDF, 528 KB Exhibit 24 93–100 PDF, 548 KB Exhibit 31 101–102 PDF, 532 KB Exhibit 32 103–104 PDF, 528 KB Document and Entity Information 105 PDF, 528 KB Parentheticals and Phantom 106–107 PDF, 532 KB
Proxy Statement Click to download. Section Page(s) Format & Size Entire Proxy Statement 1–69 PDF, 268 KB