The business unit reports outlined in this document include a significant amount of information on the environmental, safety and health performance and community interaction across the business operations of the Wesfarmers Group. There have been some changes to the treatment of data and these changes have been highlighted and explained. In particular we have included four years of data wherever possible to allow for comparison.
In addition, there is a summary of the sustainability performance of those parts of the Wesfarmers Group that do not fall directly under the nine operating divisions for 2009/10.
Economic contribution
Starting as a farmer’s cooperative in 1914, the company has progressively evolved and diversified to become one of Australia’s largest publicly listed companies and one of the country’s largest private sector employers, with more than 500,000 shareholders and approximately 200,000 employees at the report date.
In addition, as at June 2010, there were over 50 Australian superannuation funds, each of which held more than 100,000 shares in Wesfarmers and which together held nearly eight per cent of issued capital. Together with many funds holding smaller parcels of shares, or those investing in Wesfarmers through fund managers, this means that many Australian investors have a shared interest in the sustainable future of Wesfarmers and our capacity to continue to provide value to and satisfactory returns for shareholders, while delivering appropriate environmental and social outcomes, that are within our control, for society.
Our major operating business interests in the full year covered by this report include supermarkets, liquor and convenience stores; home improvement and office supplies; general merchandise and apparel; coal mining; insurance; industrial and safety products distribution; chemicals and fertilisers manufacture; and gas production and distribution and power supply.
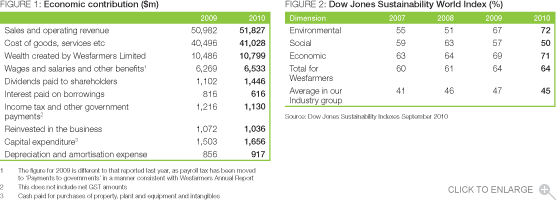
In the year to 30 June 2010, we recorded a net profit after tax of $1,565 million, compared to $1,522 million in 2008/09. Key indicators of the Group’s financial performance indicators and economic contribution to society are summarised in figure 1.
Overall, our operations make a significant contribution to the economies of Australia and New Zealand. These contributions included $6,533 million paid in salaries and wages to employees, dividends to our shareholders totalling $1,446 million and $1,130 million paid to governments at all levels in the form of taxes, levies and royalties (not including net GST). More than 95 per cent of our revenues and earnings are derived from our Australian operations.
In addition, during the year Wesfarmers spent $1,656 million on capital expenditure on opening new stores, renewing existing locations, investing in our resources and industrial businesses and purchasing land. This expenditure also supports direct employment in Australia and New Zealand as well as the businesses of many suppliers and contractors involved in these capital expenditure programs.
We are one of 20 Australian companies selected for inclusion in the Dow Jones Sustainability World Index for 2010 (as at 20 September 2010). The Index includes the top 10 per cent of the 2,500 biggest companies in the Dow Jones World Index in terms of corporate sustainability after assessment against economic, environmental and social criteria. We were also one of 30 Australian companies selected for inclusion in the Dow Jones Sustainability World Indexes for the Asia Pacific region (DJSI World – Asia Pacific).
The DJSI assessment (with assessments against the DJSI criteria) of Wesfarmers over the past four years has been shown in figure 2. More information is available at www.sustainability-index.com
Environmental footprint
Wesfarmers’ diversified structure, in terms of the range of its businesses and the Group’s geographical spread, principally across Australia and New Zealand, means the company is responsible for managing a wide range of environmental issues.
Because of this diversity, the Group’s overall environment policy requires business units to develop policies and procedures that are relevant to their particular circumstances, while ensuring that these policies and actions are in line with the Group’s overarching guideline of ‘placing strong emphasis on protection of the environment’.
Across the Group a number of significant environmental programs are being developed and implemented, with the major single program this year being the range of conservation related activities associated with the Blackwater Creek diversion at our Curragh minesite. Other significant programs during the year, many of which are described in more detail in the divisional sections of this report (or where applicable in the division’s own on-line sustainability reports) include e-waste recovery and recycling being co-ordinated by Officeworks; Bunnings sourcing 99 per cent of its timber products from legal or certified sustainable forest operations; the successful continuation of programs in several of our businesses to remove single use plastic shopping bags from our businesses where it is possible; an increase in recycling of used packaging across our retail operations; the commissioning of new water recycling infrastructure at Australian Vinyls in Vic; and, a wide range of energy efficiency initiatives being funded and implemented across all of our businesses.
We recognise that the use of fuels other than petrol and diesel is becoming increasingly important in the context of both achieving lower overall pollution levels and the climate change debate. We encourage the purchase of vehicles suitable for liquefied petroleum gas (LPG) use where practical, in recognition of LPG’s environmental benefits over petrol and diesel. We continue our efforts, through our Kleenheat business, to expand the market for liquefied natural gas (LNG) as a substitute for diesel in the heavy duty vehicle and remote power generation sectors. The first full year operation of a 175 tonne-per-day LNG plant at the Wesfarmers LPG site at Kwinana and investment in distribution infrastructure and two remote area power stations has increased the availability of LNG as an alternative fuel in Western Australia.
Group environmental indicators
The information in this section includes data over four years wherever possible. Some of our businesses find that issues such as water and waste are difficult to accurately measure because of the shared location of their facilities, and some of the former Coles group of companies did not collect some of this data prior to being acquired by Wesfarmers in November 2007. In the past year we have made considerable efforts to rectify the data gaps in some businesses from previous reports, particularly in relation to water use – these efforts are shown in the various figures in this part of the report, but in particular our water use data is now complete although some businesses (that operate largely in buildings owned by others) have to estimate water use from actual data in facilities where they can gather it.
Where an environmental issue is specific to one or just a few businesses (e.g. land remediation) it is reported in that division’s section of this report rather than in an aggregated form for the Group.
Greenhouse gas emissions
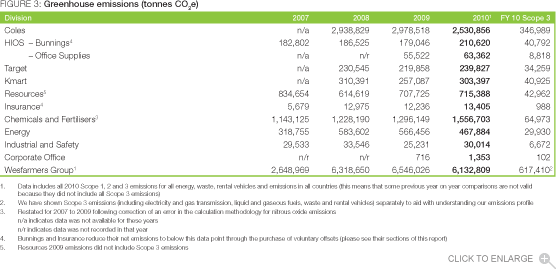
Prior to 2008/09 we based our greenhouse gas emissions measurement on the AGO methodology. However, from 2008/09 Wesfarmers has registered as a controlling corporation under the National Greenhouse and Energy Reporting Act (NGER) for which has been published a very complex set of reporting determinations that we are required to follow (and which can change slightly from year to year as the DCCEE refines its data collection). This means that some of our data is not directly comparable year on year, but where possible this is explained in the text. At the time of this report’s preparation Wesfarmers reported 5,164,544 tonnes CO2e in our NGER report (our Scope 1 and Scope 2 emissions), while this report declares 6,132,809 tonnes CO2e (a difference of 968,265 tonnes CO2e). The difference is created by the definitional and legal requirements of NGER with the major components (all quoted as approximate data in tonnes CO2e) comprising Scope 3 emissions which include electricity and gas transmission emissions and waste emissions, (618,500); refrigerant gases excluded from NGER (36,428); Air Liquide WA, which is reported in NGER by Air Liquide Australia (78,000); several remote power stations in WA which are defined as being under the operational control of their minesite customer (166,992 tonnes); New Zealand and other country emissions (15,000); and, the Coregas air separation unit at Port Kembla, NSW, which is deemed for NGER purposes not to be under the operational control of Coregas (3,168). Other emissions included in figure 3 include gas transmission factors and waste-related emissions and some industrial emissions not able to be recorded in the NGER regulatory system (approximately 46,000 tonnes).
Our total direct and indirect greenhouse emissions for the Group in 2009/10 (converted to CO2e) were estimated at 6.13 million tonnes (see figure 3). This was approximately 400,000 tonnes CO2e below emissions reported for last year. The two major reasons for this apparent decline were firstly the implementation of more effective measurement systems for refrigerant loss in Coles facilities (to replace the estimates made under the NGER law in 2008/09), which reduced reported emissions by over 300,000 tonnes; and, secondly the Chemicals and Fertilisers business rectifying an error in its calculation of nitrous oxide emissions from its nitric acid plants in Kwinana (WA) which reduced reported emissions by 247,482 tonnes. To an extent these reductions were balanced by an increase in our recording and reporting of Scope 3 emissions from waste disposal and other issues. With these changes our future year reports should be comparable to this year’s report, given that we will always report higher emissions than our NGER Act report because the NGER law does not cover Scope 3 or other country emissions. We intend to continue including information in the report text to explain the differences, and the reader can also send specific questions to us at info@wesfarmers.com.au
As foreshadowed in last year’s report, our greenhouse emissions and energy use were also higher this year as production at our WA ammonia and LPG facilities returned to normal levels following the disruption to gas supplies to the south-west of WA in 2008/09.Wesfarmers was again a respondent to the Carbon Disclosure Project (CDP) in 2010. Our submission is publicly available on the CDP website www.cdproject.net and provides full disclosure on our greenhouse emissions and our overall approach to climate change issues.
Wesfarmers is of the view that regulated carbon emission reductions will be implemented in Australia (and are already in place in New Zealand) as a response to the science and potential impacts of human induced climate change. Indeed the major political parties both have policy positions of five per cent reductions in carbon emissions by 2020 on a year 2000 base, which represents a challenging 25 per cent reduction on business as usual emissions. We will play a part in the continuing policy debate in Australia and are, as our most immediate contribution, implementing significant energy efficiency programs across the Group. It will be important for the eventual policy and laws to be based on market based approaches to the extent possible in setting carbon prices, and Australian and New Zealand export (or import competing) industries will need support in the transition to a wider application of carbon constraints across our trading partners.
As part of our overall efforts to reduce emissions, we continue to contribute to a major emissions reduction initiative, the Coal21 Fund, which levies coal producers to fund research into low emission coal technologies. Our contribution to this fund is likely to reach $30 million over 10 years.
In addition, the emissions related to our use of commercial air travel were 36,142 tonnes of CO2e (this number was calculated based on actual emissions from fuel burnt, the agreed National Greenhouse Accounts factor for ground support, and the forcing factor to account for emissions at altitude). Two of the businesses in which Wesfarmers is an investor, Bengalla mine in NSW (40 per cent) and Queensland Nitrates Pty Ltd in Qld (50 per cent) report their Scope 1 and Scope 2 emissions under the NGER Act – their total reported emissions for 2008/09 were 987,236 tonnes CO2e and on an equity basis Wesfarmers’ share of these emissions would be 451,939 tonnes CO2e.
Energy use
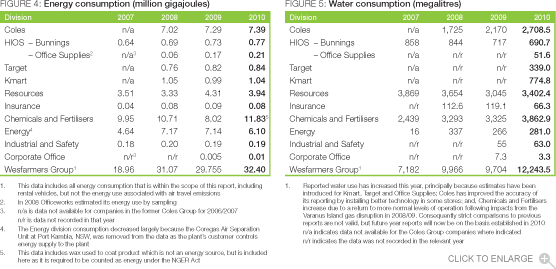
The total estimated energy use for our Group in 2009/10 was 32.40 million gigajoules, an increase of about 8.84 per cent on last year. Again, most of the increase was due to the resumption of usual gas supplies to the south-west of WA in 2009/10 following the resolution of the Varanus Island incident in WA in 2009, which constrained supplies of natural gas to the Energy, and Chemicals and Fertilisers divisions. Our energy usage is summarised in figure 4.
Wesfarmers is registered under the Federal Government’s Energy Efficiency Opportunities (EEO) laws, with an Assessment and Reporting Schedule (ARS) for our Group gaining regulatory approval in 2008. We subsequently submitted a revised ARS for the Wesfarmers Group, to suggest the removal of many small facilities from the formal assessment process. The revised ARS incorporates assessment of at least 92 per cent of all Wesfarmers energy use, covering the Group’s large energy users across the retail, industrial and insurance operations and was approved by the regulator in May 2010. It will form the basis of our EEO Act report for 2009/10 to be submitted in December 2010.
We submitted our second public and government reports under the EEO legislation in December 2009, and the public report is available on our website at www.wesfarmers.com.au
As part of the (then) preparation for the introduction of a national carbon emissions trading scheme, the Federal Government commenced the NGER scheme on 1 July 2008. This system records the majority of Australia’s greenhouse emissions and energy use. Wesfarmers registered for NGER in October 2008 and has implemented a Group-wide, internet-based, information management system (Wesfarmers Greenhouse and Energy Reporting System – WESGERS) to both manage our NGER reporting obligations, to inform and monitor our many energy efficiency programs in the future, and assist in dealing with a carbon constraint when there is a settled policy in Australia.
The energy consumption data in our NGER report for 2009/10 (41.04 million gigajoules) is different to the data in figure 4 in this report. The difference relates to the legal and definitional issues required by NGER, many of which are of similar nature to the differences in the greenhouse data between this report and our NGER report described in the greenhouse emissions section of this report. In addition Wesfarmers generated approximately 12.3 million gigajoules of energy from several businesses for consumption by others.
Water consumption
Estimated water use (reused, scheme, recycled and ground water) across the Group totalled 12,244 megalitres (see figure 5). Of this total 5,805 megalitres was scheme water sourced from public supply systems. Last year’s estimated total Group consumption was 9,704 megalitres, with the reported increase largely due to increased water use in our chemicals business at Kwinana as it returned to full production after the gas supply interruption; reporting water use in Target, Kmart and Officeworks for the first time; and a reported increase in Coles water use which for the first time includes the liquor and convenience stores. A slight decrease in Bunnings’ water use reflected their water saving initiatives of the past few years. In 2010 we also participated in the first CDP Water survey (by invitation) and the outcomes of that process should be available at www.cdproject.net in November 2010.
Waste
Solid and liquid waste data is presented, to the extent it is available and can be verified, in each of the divisional reports.
In each of those reports there are comments on many of the waste reduction and recycling initiatives undertaken. As a result of these programs and initiatives, our retail businesses alone recycled more than 194,000 tonnes of consumer packaging materials during the year.
All of our retail businesses are signatories to the National Packaging Covenant (NPC) through the registration of Wesfarmers Limited in 2009, which aggregated their previous individual registrations – the NPC is being replaced by the Australian Packaging Covenant (APC) in 2010/11 and Wesfarmers registered for the APC in September 2010. The NPC is a voluntary packaging waste reduction and recycling initiative underpinned by a National Environment Protection Measure, and all retail businesses reported publicly on their activities in late 2009 – this report is available at www.wesfarmers.com.au and at www.packagingcovenant.org.au
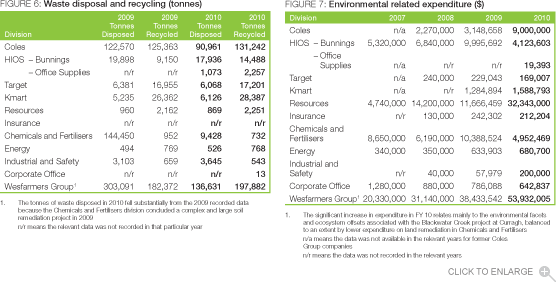
Data on waste disposed to landfill is materially complete this year with only the Corporate Office and the Insurance Division being unable to reliably estimate or measure waste disposed to landfill, largely by virtue of those parts of the Group occupying leased space in larger buildings for most activities. However the total waste to landfill from these two parts of the Group is not thought to be material in the overall Group data. We are not yet in a position to consistently report on our liquid waste disposal, particularly because we have so many retail stores in shared facilities without individual waste water invoicing. Our waste disposal and recycling data is presented in figure 6.
Non-compliance/prosecutions
We are not aware of any significant non-compliance with environmental regulations or any prosecutions relating to environmental issues during the year other than disclosed in the various business reports. In several of the business reports, there are detailed comments dealing with interactions with the various regulators during the year.
National Pollutant Inventory (NPI)
All of the Group’s Australian businesses required to report under the NPI (Resources, Chemicals and Fertilisers, and Energy) do so each year. Full details are available on the NPI website www.npi.gov.au, with 2009/10 data available at the end of January 2011. All of our reported emissions were regarded as low, except for vinyl chloride monomer emissions at Australian Vinyls (largely by virtue of it being the sole Australian manufacturer of PVC).
Environmental expenditure
Total environmental expenditure, including land remediation costs for the full 12 months, is $53.93 million (see figure 7). This compares with a 2008/09 total of $38.43 million. These costs include salaries and overheads, specific environmental projects and any other costs (such as fees paid to consultants) for environment-related purposes. The major reason for the increased expenditure this year was the cost associated with conservation and rehabilitation works and vegetation offset provision associated with the Blackwater Creek diversion project at the Curragh minesite.
Contamination
Remediation of site contamination is an issue for some of our businesses and details are provided in the individual divisional reports. The most significant of these involve our Chemicals and Fertilisers business (CSBP), some former forest products operations (Sotico) and some sites formerly operated by Wesfarmers Transport, a business that was sold several years ago. Wesfarmers is responsible for this remediation and financial provision has been made to cover the estimated cost of these activities.
CSBP engaged in remediation of a former fertiliser site at Bayswater in WA.
During the year Wesfarmers made some significant progress at the Pemberton and Manjimup sites formerly owned by Sotico in WA, with extensive investigation, monitoring and review efforts. The report by the Appointed Independent Expert for Sotico and the Western Australian Government on our Pemberton site was completed and ownership of the remediated site has now been transferred to the state of WA as provided for in our agreement with the State. As reported last year, near the Manjimup site there are several properties owned by third parties that were classified as ‘Contaminated – Remediation Required’ under the WA Contaminated Sites Act 2003. Our efforts this year have continued to be directed at investigating and modelling groundwater in the area to demonstrate that the risk to these properties is minimal, and allow consideration for the site classification to be amended (in August 2010 the DEC advised that these third party sites had been reclassified under the Act as ‘Not Contaminated – Unrestricted Use’). We also implemented a groundwater treatment technology at the former Sotico site which appears to have been very successful in reducing the extent of groundwater contamination, and the overall concentration of contamination. Monitoring and risk assessment continued variously at the former Wesfarmers Transport sites in Kewdale, Carnarvon and Port Hedland in WA, together with additional remediation activities. In September 2010 the DEC advised that the Carnarvon properties had been reclassified as ‘Remediated – Restricted Use’ under the Act which allows for the site owner’s planned land use to now proceed. At the former Wesfarmers Transport site in Bassendean WA the DEC also issued a site classification of ‘Remediated – Restricted Use’ and we continue to monitor groundwater at that site.
Social
Our people
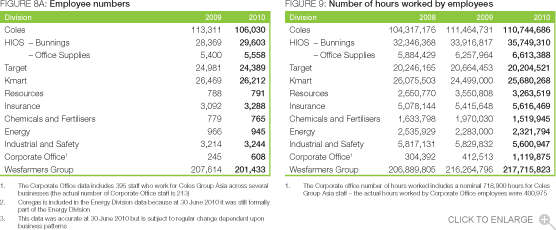
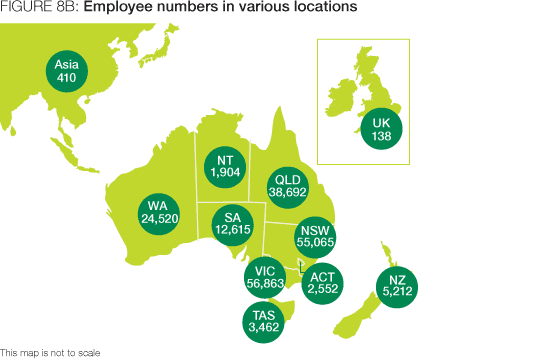
Wesfarmers is one of Australia’s largest private sector employers. More than 99 per cent of our more than 200,000 strong workforce is located in Australia and New Zealand (see figures 8A and 8B).
A liquefied petroleum gas import terminal and distribution facility in Bangladesh, operated by a joint venture in which we are the majority partner, employs about 46 people, approximately 395 people are employed at our retail offices in Asia and over 100 people in our Insurance business in the United Kingdom.
Businesses where we are an investor, but not the operator, also provide substantial employment. Overall, in 2009/10, we paid $6.53 billion in salaries, wages and other benefits and our employees worked over 217 million hours (see figure 9).
In terms of workplace relations, we recognise the right of those we employ to negotiate either individually or collectively, with or without the involvement of third parties. The large majority of our employees are covered by collective agreements. At the same time, the company believes in maximising the flexibility of workplace arrangements available to employees and their managers.
Wesfarmers operates an employee share scheme and during the year 97 per cent of employees from eligible businesses took up the award of shares, while nine per cent of employees from eligible businesses applied to participate in the salary sacrifice share plan.
Wesfarmers recognises the significant social and commercial value of diversity at all levels of its workforce, and seeks to leverage each individual’s unique skills, background and perspectives. Gender diversity has been and continues to be a priority for the group. As at 30 June 2010, approximately 57 per cent of our employees are female. Two of our 11 Board members (18 per cent), one of the 11 members of the Wesfarmers leadership team (nine per cent) and 23 of 121 Wesfarmers divisional executive team members (19.8 per cent) are female.
We have established policies across the Group aimed at ensuring that each person has equal access to employment opportunities, and that the benefits of employment are based on the principle of merit. Each business unit is required to complete an annual report to the Equal Opportunity for Women in the Workplace Agency. These reports outline strategies implemented to enhance the representation of women in our businesses.
Given our autonomously operating business unit structure, training is one of the key human resource issues within the direct responsibility of business units. At the same time, key human capital development policies and processes apply across the Group. These include remuneration policies for the Group’s senior managers and workplace anti-discrimination and succession planning. Our recorded commitment in training and development was 1.91 million hours (but we expect this to increase in future years, both through increased development programs and through better recording of activity).
We have a code of ethics and conduct that covers employee behaviour and while business units are encouraged to adopt standards that align best with their activities, these must embody the principles laid down in the Group code, which is available on our website. Also available on our website is our Group Whistleblower Policy which encourages employees to raise any concerns and report instances of unethical, illegal, fraudulent or undesirable conduct, where there are reasonable grounds to suspect such conduct, without fear of intimidation, disadvantage or reprisal.
Safety
Workplace safety remains one of the Group’s highest priorities. We believe we have an obligation to do all we can to ensure the safety in the workplace of everyone who works for our company, our visitors and customers.
We have a Group target of reducing accident rates by 50 per cent each year towards a goal of zero. The primary measure is the Lost Time Injury Frequency Rate (LTIFR).
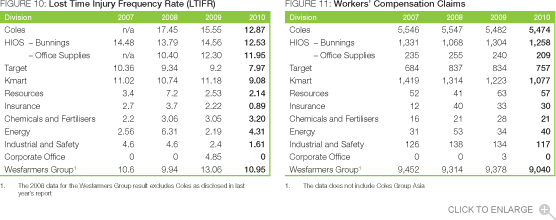
This year saw an overall improvement in the Group’s reported safety performance, as measured by the LTIFR. For the reporting period, the Group LTIFR was 10.95, down from 13.06 for the previous corresponding period. There were 2,384 Lost Time Injuries over the period, compared to 2,825 in 2008/09. We have also introduced another measure of performance across the Group this year, being the Total Recorded Injury Frequency Rate (TRIFR) which essentially measures the frequency of all injuries requiring medical attention, or causing at least a work shift lost from the business – the TRIFR in 2009/10 was 89.4 and we will report further on that in future years.
On a business-by-business basis, Air Liquide WA, the Corporate Office and enGen maintained a zero LTIFR and almost all businesses recorded significant improvements in their safety performance as measured by the LTIFR. Details of individual business safety outcomes are found in figure 10 and their individual reports.
While the LTIFR remains the main Group-wide measure of safety performance, operating businesses are encouraged to use a range of broader measures to promote a more proactive approach and support a culture of safe work practices. These include statistics on all injuries, near misses and restricted work cases. Details, where applicable, are available in their individual sections of this report, or their own divisional reports on the websites.
The number of workers’ compensation claims during the year fell from 9,378 to 9,040 (see figure 11).
In August 2010 there was unfortunately a fatality at our Curragh minesite in Qld involving a contractor in an on-site light vehicle accident.
Non-compliance/prosecutions
Details of instances where individual divisions are the subject of potential regulatory breaches are included in the various business reports.
Governance
In our 2010 Annual Report (available at www.wesfarmers.com.au) we provide a very detailed account of the governance structure and responsibilities of Wesfarmers Limited.
The Board’s charter requires it to have a majority of non-executive independent directors, a non-executive independent Chairman and different people filling the roles of Chairman and Chief Executive Officer.
Three standing Board committees (Nomination, Remuneration and Audit) review matters on behalf of the Board and make necessary recommendations.
The Board’s Market Disclosure Policy, which covers announcements to the Australian Securities Exchange, prevention of selective or inadvertent disclosure, conduct of investor and analyst briefings, media communication and other issues, is supported by an education and training program overseen and monitored by the Audit Committee. Pages 58 to 66 of the 2010 Annual Report set out in detail the approach to ethical business behaviour and governance of Wesfarmers and therefore will not be covered in detail in this report.
Community contributions and partnerships
The continuing successful operation of the Group’s businesses, in an ethical and socially responsible way, is the cornerstone of our contribution to the community. Through the creation of employment opportunities and the flow of economic benefits to employees, shareholders, and suppliers, and through the payment of taxes and royalties to governments, we are committed to having a positive impact in the broader community.
In addition, we believe in supporting the local communities and wider society in which we operate by direct and indirect assistance to organisations and activities that provide a public benefit. That support is delivered by direct financial assistance and partnerships with Wesfarmers Limited, the parent company, and through financial contributions, sponsorships and other direct and indirect assistance from the Group’s individual businesses. The scope of many of these community investments is outlined in each of the various divisional reports.
The Board of Wesfarmers Limited contributes up to 0.25 per cent of the Group’s before-tax profit each year (in 2009/10 $3.70 million was contributed to community organisations). In deciding the distribution of these funds, the Board gives preference to activities focused on medical research and health, Aboriginal partnerships and education and the Wesfarmers Arts program.
Wesfarmers Arts
Wesfarmers supports a number of Australia’s leading arts companies through the award-winning Wesfarmers Arts sponsorship program. This involvement stems from a belief that a vibrant cultural sector makes a positive contribution to the life of the community. The company’s nationally recognised collection of Australian art is shared with the public through exhibitions and loans to galleries across the country. During the year, works from the collection were displayed in several major touring exhibitions including John Brack, from the National Gallery of Victoria, Rupert Bunny presented and toured by The Art Gallery of New South Wales and the 2009 Western Australian Indigenous Art Awards.
A highlight of the year was the launch of the Wesfarmers Arts Indigenous Fellowships in partnership with the National Gallery of Australia. Developed in consultation with Aboriginal leaders and communities across all states, the Fellowship is the only professional development program of its kind in Australia to foster Aboriginal leadership in the visual arts.
Political donations
During the year, the Wesfarmers Board decided that the company would cease donating to political parties. Financial contributions only have been made by Wesfarmers Limited and not by any of our business units. Before the decision was taken, we provided a total of $120,000 (donations and fees), split between the Liberal Party, the Australian Labor Party and the National Party in the 2009/10 financial year. All donations are disclosed in November after the end of the financial year concerned to the Australian Electoral Commission which publishes this information on its website, www.aec.gov.au
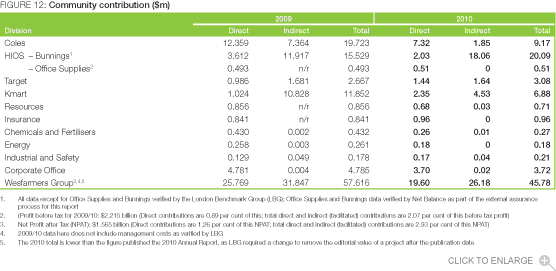
As referred to earlier in this report, LBG undertakes a verification process across the Wesfarmers Group (with the exception of the Home Improvement and Office Supplies division, whose community contributions were assured by Net Balance as part of its overall assurance of this report – please note its Assurance Statement on page 74 for specific comment on our community contributions) and provides us with a report on which the data in figure 12 are based, as well as the verification statement opposite.
The scope of many of our contributions is explained in the various divisional reports. However, some significant activities during the year included the continuation of annual contributions of $900,000 to the Western Australian Institute of Medical Research; the Bunnings community barbeques that allowed community groups to raise approximately $17 million during the year; the Kmart Wishing Tree Appeal which helped to deliver over 400,000 gifts in late 2009 to our charity partners for distribution to families in need; and the Resources division’s support for Life Education Australia with its drug and alcohol education programs.
The total community contribution by the Group (direct and indirect) in 2009/10 was $45.78 million, which was reduced from 2008/09 because of the contribution made to appeals dealing with the tragedy of the Victorian bushfires in February 2009.
Verification Statement from LBG Australia/New Zealand

The LBG model helps businesses improve the measurement, management and reporting of their corporate community investment programs. It covers the full range of contributions (cash, time and in-kind donations) made to community causes, and assesses the results achieved for the community and for the business.
As managers of LBG Australia/New Zealand, we have worked with Wesfarmers Limited to review its understanding and application of the LBG model in respect of the wide range of community programs supported. Our aim has been to ensure that the evaluation principles have been correctly and consistently applied. Having conducted an assessment, we are satisfied that this has been achieved. Our work has not extended to an independent audit of the data.
Jessica Pattison
LBG Manager
September 2010

Wesfarmers’ partnership with leading Australian arts companies allow organisations like West Australian Ballet to foster young talent, work in regional communities and produce work for the national stage.
Photography courtesy of Jody D’Arcy

