|
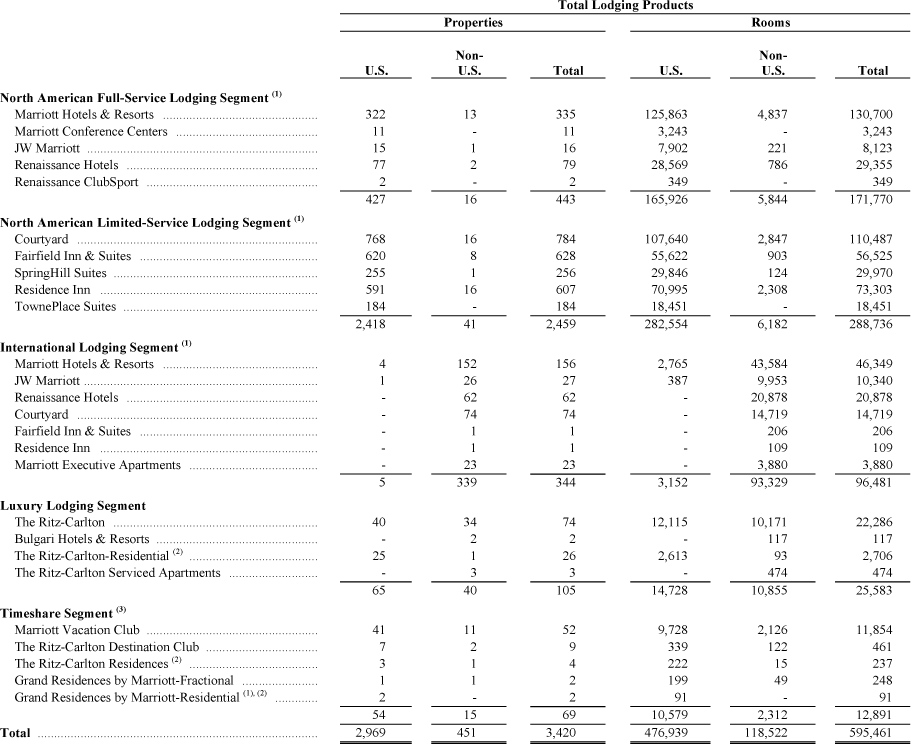
Net Losses Attributable to Noncontrolling Interests 2008 Compared to 2007 (Loss) Income from Continuing Operations 2008 Compared to 2007 Business Segments See Footnote No. 19, "Business Segments" for further information on: (1) our segments including how we aggregate our individual brands into each segment, and other information about each segment, including: revenues; (loss) income from continuing operations attributable to Marriott; net losses attributable to noncontrolling interests; and equity in earnings (losses) of equity method investees; (2) revenues, financial results, and fixed assets associated with operations outside the United States; and (3) selling expenses. At year-end 2009, we operated or franchised the following properties by segment (excluding 2,072 corporate housing rental units associated with our ExecuStay brand): |
|
|
|
2009 Compared to 2008 Total segment financial results decreased by $1,162 million (100 percent) to $4 million in 2009 from $1,166 million in 2008, and total segment revenues decreased by $1,986 million to $10,831 million in 2009, a 15 percent decrease from total segment revenues of $12,817 million in 2008. As discussed in more detail earlier in this report, demand was weaker in 2009 than 2008. The decrease in revenues included a $1,152 million decrease in cost reimbursements revenue, which does not impact operating income or net income attributable to Marriott. The results, compared to 2008, reflected $685 million of Timeshare impairment charges ($614 million of which were reported in the "Timeshare strategy – impairment charges" caption and $71 million of which we reported in the "Timeshare strategy – impairment charges (non-operating)" caption of our Consolidated Statements of Income. See the "Timeshare strategy – impairment charges" section for more information on the impairments), $157 million of lower incentive management fees, a $156 million decrease in combined 2009 base management and franchise fees, $85 million of owned, leased, corporate housing, and other revenue net of direct expenses, $63 million of lower equity joint venture results, $18 million of higher restructuring costs, a $13 million decrease in net losses attributable to a noncontrolling interests benefit, a decrease of $9 million in gains and other income, and a decrease of $6 million in Timeshare sales and services revenue net of direct expenses, partially offset by $30 million of decreased general, administrative, and other expenses. As discussed in the "Restructuring Costs and Other Charges" section, these decreases included $80 million in other charges, with $57 million recorded in general, administrative, and other expenses and $23 million recorded in Timeshare sales and services revenue net of direct expenses. The $156 million decrease in combined base management and franchise fees reflected lower demand and significantly lower RevPAR in 2009. Incentive management fees decreased by $157 million and reflected lower property-level operating revenues and margins associated with weak demand, somewhat offset by property-level cost controls. With lower property-level operating income, many managed properties did not earn sufficient income to achieve owner priority returns and, as a result, we earned no incentive fees from those properties. In 2009, 67 percent of our incentive fees were derived from hotels outside North America versus 49 percent in 2008. Systemwide RevPAR, which includes data from our franchised properties, in addition to our owned, leased, and managed properties, for comparable North American properties decreased by 17.2 percent, and RevPAR for our comparable North American company-operated properties decreased by 18.5 percent. Systemwide RevPAR for comparable international properties decreased by 17.9 percent, and RevPAR for comparable international company-operated properties decreased by 18.0 percent. Worldwide RevPAR for comparable systemwide properties decreased by 17.3 percent (18.4 percent using actual dollars) and worldwide RevPAR for comparable company-operated properties decreased by 18.3 percent (20.0 percent using actual dollars). Compared to 2008, worldwide comparable company-operated house profit margins in 2009 decreased by 380 basis points and worldwide comparable company-operated house profit per available room ("HP-PAR") decreased by 25.7 percent on a constant U.S. dollar basis, reflecting the impact of very tight cost control plans in 2009 at properties in our system, more than offset by the impact of year-over-year RevPAR decreases. International company-operated house profit margins declined by 270 basis points, and HP-PAR at our International managed properties decreased by 22.0 percent reflecting significant cost control plans at properties, more than offset by the impact of decreased demand. North American company-operated house profit margins declined by 440 basis points, and HP-PAR at our North American managed properties decreased by 27.7 percent also reflecting significant cost control plans at properties, more than offset by the impact of decreased demand. HP-PAR at our North American limited-service managed properties decreased by 28.7 percent, reflecting cost control plans at properties, more than offset by the impact of decreased demand. 2008 Compared to 2007 Total segment financial results decreased by $422 million (27 percent) to $1,166 million in 2008 from $1,588 million in the prior year, and total segment revenues decreased by $92 million to $12,817 million in 2008, a 1 percent decrease from revenues of $12,909 million in 2007. While demand was weaker in 2008 compared to 2007, international and full-service properties experienced stronger demand than luxury and limited-service properties. The decrease in revenues included a $259 million increase in cost reimbursements revenue, which does not impact operating income or net income. The results, compared to the year-ago period, reflected a decrease of $261 million in Timeshare sales and services revenue net of direct expenses, $58 million of lower incentive management fees, $51 million of increased general, administrative, and other expenses, a decrease of $37 million in gains and other income, $29 million of restructuring costs recorded in 2008, a decrease of $22 million in owned, leased, corporate housing, and other revenue net of direct expenses, and $14 million of lower equity joint venture results. These unfavorable variances were partially offset by a $27 million (3 percent) increase in combined base management and franchise fees to $1,086 million in the 2008 period from $1,059 million in 2007 and a $23 million increase in net losses attributable to noncontrolling interests. Higher RevPAR for comparable rooms, resulting from rate increases in international markets, and new unit growth drove the increase in base management and franchise fees. The $27 million increase in combined base management and franchise fees also reflected the impact of both base management fees totaling $6 million in 2007 from business interruption insurance proceeds and $13 million of lower franchise relicensing fees in 2008. Compared to 2007, incentive management fees decreased by $58 million (16 percent) in 2008 and reflected the recognition in 2007 of $17 million of incentive management fees that were calculated based on prior periods' results, but not earned and due until 2007. Furthermore, incentive management fees for 2007 also included $13 million of business interruption insurance proceeds, also associated with hurricanes in prior years. The decrease in incentive management fees also reflected lower property-level profitability due to lower RevPAR, higher property-level wages and benefits costs, and utilities costs, particularly in North America. In 2008, 56 percent of our managed properties paid incentive management fees to us versus 67 percent in 2007. In addition, in 2008, 49 percent of our incentive fees were derived from international hotels versus 35 percent in 2007. Systemwide RevPAR, which includes data from our franchised properties, in addition to our owned, leased, and managed properties, for comparable North American properties decreased by 2.7 percent and RevPAR for our comparable North American company-operated properties decreased by 2.9 percent. Systemwide RevPAR for comparable international properties increased by 3.6 percent, and RevPAR for comparable international company-operated properties increased by 3.3 percent. Worldwide RevPAR for comparable systemwide properties decreased by 1.5 percent (0.8 percent using actual dollars) while worldwide RevPAR for comparable company-operated properties decreased by 1.1 percent (0.2 percent using actual dollars). Compared to the year-ago period, worldwide comparable company-operated house profit margins in 2008 decreased by 70 basis points, reflecting the impact of stronger year-over-year RevPAR associated with international properties and very tight cost control plans in 2008 at properties in our system, more than offset by the impact of year-over-year RevPAR decreases associated with properties in North America reflecting weaker demand and also higher expenses in North America primarily due to increased utilities and payroll costs. North American company-operated house profit margins declined by 140 basis points reflecting significant cost control plans at properties, more than offset by the impact of decreased demand and higher operating costs, including those associated with wages and benefits and utilities. For 2008, HP-PAR at our North American managed properties decreased by 5.8 percent. HP-PAR at our North American limited-service managed properties decreased by 8.0 percent, and worldwide HP-PAR for all our brands increased by 2.6 percent on a constant U.S. dollar basis. > Back to top of page |
|