
|
Luxury Lodging includes The Ritz-Carlton and Bulgari Hotels & Resorts. |
|
 |
|
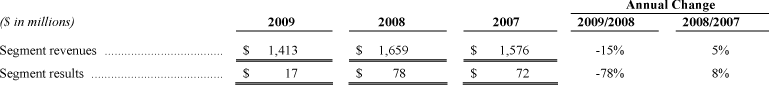
2009 Compared to 2008 In 2009, RevPAR for comparable company-operated luxury properties decreased by 22.7 percent to $175.66, occupancy for these properties decreased by 6.8 percentage points to 59.5 percent, and average daily rates decreased by 13.8 percent to $295.11. Luxury Lodging has been particularly hurt by weak demand associated with the financial services industry and other corporate group business. The $61 million decrease in segment results, compared to 2008, reflected a $20 million decrease in joint venture equity earnings, a $17 million decrease in base management fees, $13 million of lower owned, leased, and other revenue net of direct expenses, a $6 million decrease in incentive management fees, and $5 million of increased general, administrative, and other expenses. The $20 million decrease in joint venture equity earnings primarily reflected a $30 million impairment charge in 2009 associated with a joint venture investment that we determined to be fully impaired, partially offset by a $9 million impairment charge associated with a joint venture investment that we determined to be fully impaired in 2008 (see the "Other Charges" caption in the "Restructuring Costs and Other Charges" section for more information). The $17 million decrease in base management fees was largely driven by RevPAR declines associated with weaker demand. The $6 million decrease in incentive management fees was largely due to lower property-level revenue and margins in 2009 compared to 2008, a result of weak demand, partially offset by property-level cost controls and new unit growth. The $13 million decrease in owned, leased, and other revenue net of direct expenses primarily reflected $5 million of lower results at three properties driven by weak demand and the resulting RevPAR declines in 2009 and $6 million of lower residential branding fees. The $5 million increase in general, administrative, and other expenses in 2009 reflected $4 million in bad debt expense related to an accounts receivable balance we deemed to be uncollectible, $5 million of expenses primarily related to write-offs of other assets that we deemed non-recoverable, $3 million in start-up costs related to a new brand, and a $2 million performance cure payment for one property, partially offset by $9 million in cost reductions related to our cost containment efforts. Cost reimbursements revenue and expenses associated with our Luxury segment properties totaled $1,143 million in 2009, compared to $1,350 million in 2008. 2008 Compared to 2007 In 2008, RevPAR for comparable company-operated luxury properties decreased by 0.1 percent to $225.87, occupancy for these properties decreased by 1.9 percentage points to 69.2 percent, and average daily rates increased by 2.7 percent to $326.63. The $6 million increase in segment results, compared to 2007, reflected a $7 million increase in base management and incentive management fees and $18 million of higher owned, leased, and other revenue net of direct expenses, partially offset by $8 million of increased general, administrative, and other expenses, an $8 million decrease in joint venture equity earnings, $1 million of restructuring costs recorded in 2008, (see Footnote No. 20, "Restructuring Costs and Other Charges," in our 2008 Form 10-K for additional information), and a $1 million decrease in gains and other income. The increase in fees over the year-ago period reflected new properties added to the system, partially offset by the receipt in 2007 of $5 million of business interruption insurance proceeds associated with hurricanes in prior years. The $18 million increase in owned, leased, and other revenue net of direct expenses reflected charges of $8 million in 2007 for depreciation expense associated with one property that was reclassified to "held and used," as the property no longer satisfied the criteria to be classified as "held for sale," compared to $6 million of depreciation charges for that same property in 2008, as well as expenses totaling $3 million in 2007 associated with opening a new leased property, $10 million of improved results in 2008 associated with two properties, one of which was being renovated in 2007, and $2 million of increased branding fees in 2008. The $8 million increase in general, administrative, and other expenses primarily reflected costs associated with unit growth and development as well as bad debt expense related to accounts receivable deemed uncollectible (see the "Other Charges" caption in Footnote No. 20, "Restructuring Costs and Other Charges," in our 2008 Form 10-K for more information). The $8 million decrease in joint venture equity earnings primarily reflected a $9 million impairment charge associated with a joint venture investment that we determined to be fully impaired in 2008 (see the "Other Charges" caption in Footnote No. 20, "Restructuring Costs and Other Charges," in our 2008 Form 10-K for more information). Cost reimbursements revenue and expenses associated with our Luxury segment properties totaled $1,350 million in 2008, compared to $1,307 million in 2007. > Back to top of page |
|