Vodafone at a glance
We are one of the world’s largest mobile communications companies by revenue
- Revenue (£bn)

- Adjusted operating
profit (£bn)
- Operating free cash
flow (£bn)
- Capital expenditure (£bn)


| Europe Our mobile subsidiaries and joint venture in Europe operate under the brand name 'Vodafone' and our major fixed line businesses operate as 'Vodafone' or in the case of Italy as 'TeleTu' or in Spain as 'Tele2'. | Africa, Middle East and Asia Pacific (‘AMAP’) Our subsidiaries and joint ventures in AMAP operate under the 'Vodafone' brand, or in the case of Vodacom and its mobile subsidiaries, as 'Vodacom' and 'Gateway' brands. In India we operate as 'Vodafone Essar'. Our associate in Kenya operates as 'Safaricom'. | |||||||||||||||||||||||||||||||||||||||||||||||||||||||||||||||
|---|---|---|---|---|---|---|---|---|---|---|---|---|---|---|---|---|---|---|---|---|---|---|---|---|---|---|---|---|---|---|---|---|---|---|---|---|---|---|---|---|---|---|---|---|---|---|---|---|---|---|---|---|---|---|---|---|---|---|---|---|---|---|---|---|
|
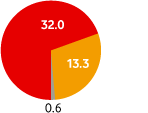
Revenue(1)
|
2.5% decrease £32.0bn (2010: £32.8bn)
|
20.0% growth £13.3bn (2010: £11.1bn)
|
||||||||||||||||||||||||||||||||||||||||||||||||||||||||||||||
|
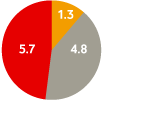
Adjusted
operating profit(1) |
9.8% decrease £5.7bn (2010: £6.4bn)
|
55.5% growth £1.3bn (2010: £0.8bn)
|
||||||||||||||||||||||||||||||||||||||||||||||||||||||||||||||
|
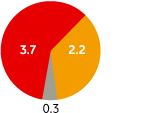
Capital expenditure(1)
|
stable £3.7bn (2010: £3.7bn)
|
6.2% growth £2.2bn (2010: £2.1bn)
|
||||||||||||||||||||||||||||||||||||||||||||||||||||||||||||||
|
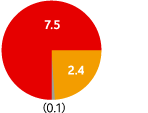
Operating free cash flow(1)
|
9.2% decrease £7.5bn (2010: £8.2bn)
|
53.7% growth £2.4bn (2010: £1.6bn)
|
||||||||||||||||||||||||||||||||||||||||||||||||||||||||||||||
|
Mobile customers by market(2)
|
|
|
- Notes:
- The sum of these amounts do not equal Group totals due to Non-Controlled Interests, Common Functions and intercompany eliminations.
- Controlled and jointly controlled businesses. Excludes 3.4 million customers representing the Group’s share of customers in our Polish joint venture Polkomtel, which is in our Non-Controlled Interests and Common Functions segment.
Non-Controlled Interests and Common Functions
Non-Controlled Interests are businesses in which we have an equity interest but do not have management control. We aim to maximise the value of these interests either by generating liquidity or increasing free cash flow. During the year we sold our interests in China Mobile and SoftBank and in April 2011 we announced an agreement to sell our 44% interest in SFR.
Common Functions primarily represent the results of the partner markets and the net result of unallocated central Group costs.
| Business | Country | Ownership at 31 March 2011 |
|---|---|---|
| Verizon Wireless | US | 45.0% |
| SFR | France | 44.0%(1) |
| Polkomtel | Poland | 24.4% |
| Bharti Airtel | India | 4.4%(2) |
| China Mobile | China | Sold(3) |
| SoftBank | Japan | Sold(4) |
£7.4bn Agreed proceeds from the sale of Non-Controlled Interests
- Notes:
- Sale announced in April 2011.
- Indirect interest.
- We previously held a 3.2% interest in China Mobile Limited.
- Our interests previously included loan notes and receivables issued by SoftBank.
Partner Markets
|
Partner markets extend our reach outside our equity investments by entering into a partnership agreement with a local mobile operator, enabling a range of our global products and services to be marketed in that operator’s territory. Under the terms of these partner market agreements we cooperate with our partners in the development and marketing of certain services and products. These partnerships create additional revenue through fees paid by the partners for access to Vodafone Group products, services and our brand portfolio without the need for equity investment. As part of the agreement for the sale of Vodafone’s interest in SFR to Vivendi, we have entered into an agreement with SFR which will continue our commercial cooperation and will allow us to continue to deliver cross-border services to customers across the major markets of western Europe. |
Over 40 Partner markets |
