| AFLAC Incorporated and Subsidiaries | ||||||||||
| 2000 | 1999 | 1998 | % Change 2000-1999 |
|||||||
|
|
||||||||||
| For the Year: | ||||||||||
| (In millions) | ||||||||||
| Total revenues | $ | 9,720 | $ | 8,640 | $ | 7,104 | 12.5 | % | ||
| Pretax earnings | 1,012 | 778 | 551 | 30.1 | ||||||
| Net earnings | 687 | 571 | 487 | 20.3 | ||||||
| At Year-End: | ||||||||||
| (In millions) | ||||||||||
| Total investments and cash | $ | 32,167 | $ | 32,024 | $ | 26,994 | .4 | % | ||
| Total assets | 37,232 | 37,041 | 31,222 | .5 | ||||||
| Shareholders' equity | 4,694 | 3,868 | 3,770 | 21.3 | ||||||
| Per Common Share: | ||||||||||
| Net earnings (basic) | $ | 1.30 | $ | 1.07 | $ | .91 | 21.5 | % | ||
| Net earnings (diluted) | 1.26 | 1.04 | .88 | 21.2 | ||||||
| Shareholders' equity | 8.87 | 7.28 | 7.09 | 21.8 | ||||||
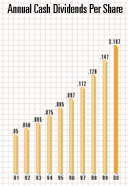
| Cash dividends | .167 | .147 | .128 | 13.6 | ||||||
| Supplemental Data: | ||||||||||
| Operating earnings* (In millions) | $ | 657 | $ | 550 | $ | 429 | 19.4 | % | ||
| Operating earnings per share* (basic) | 1.24 | 1.03 | .81 | 20.4 | ||||||
| Operating earnings per share* (diluted) | 1.20 | 1.00 | .78 | 20.0 | ||||||
| Number of common shares outstanding | 529,209,956 | 531,481,632 | 531,368,068 | |||||||
| Number of registered common shareholders | 67,995 | 69,899 | 62,525 | |||||||
| Approximate number of common shareholders | 143,400 | 148,600 | 145,500 | |||||||
| Number of full-time employees | 5,278 | 4,673 | 4,345 | |||||||
| * | Excludes realized investment gains/losses, the benefits of Japanese tax rate reductions and provisions for the policyholder protection fund in 1998 and 1999, and a benefit from the termination of a retirement liability in 2000 | |||||||||
| Share and per-share amounts have been adjusted to reflect the two-for-one stock split payable on March 16, 2001. | ||||||||||
