

|
|
|
Financials
|
|
Page
One | Page
Two | Page
Three | Page
Four | Page
Five |
Page Six | |
FINANCIALS
|
|
Notes to Consolidated Financial Statements - Continued Note 15: Earnings (Loss) Per ShareNote 16: Business Segment Information Quarterly Information (unaudited) Note 15: Earnings (Loss) Per Share We compute basic and diluted earnings per share (EPS) in accordance with Statement of Financial Accounting Standards No. 128, Earnings Per Share. Basic EPS is calculated by dividing net earnings (loss) by the weighted-average common shares outstanding during the period. Diluted EPS reflects the potential dilution to basic EPS that could occur upon conversion or exercise of securities, options, or other such items, to common shares using the treasury stock method based upon the weighted-average fair value of our common shares during the period. The following is a reconciliation of the numerators and denominators of the basic and diluted EPS computations.
Note 16: Business Segment Information We adopted Statement of Financial Accounting Standards No. 131, Disclosures about Segments of an Enterprise and Related Information (SFAS 131), in 1998. SFAS 131 requires segments to be determined and reported based on how management measures performance and makes decisions about allocating resources. We are engaged primarily in the design, manufacture and sale of laboratory instrument systems and related products. Our organization has two reportable segments: (1) clinical diagnostics and (2) life science research. The clinical diagnostics segment encompasses diagnostic applications, principally in hospital laboratories. The life science research segment includes life sciences and drug discovery applications in universities, medical schools, and pharmaceutical and biotechnology companies. All corporate activities including financing transactions are captured in a central services Center, which is reflected in the tables below. We evaluate performance based on profit or loss from operations. Although primarily operating in the same industry, reportable segments are managed separately, since each business requires different marketing strategies and has different customers.
|
||||||||||||||||||||||||||||||||||||||||||||||||||||||||||||||||||||||||||||||||||||||||||||||||||||||||||||||||||||||||||||||||||||||||||||||||||||||||||||||||||||||||||||||||||||||||||||||||||||||||||||||||||||||||||||||||||||||||||||||||||||||||||||
Quarterly
Information (unaudited)
|
||||||||||||||||||||||||||||||||||||||||||||||||||||||||||||||||||||||||||||||||||||||||||||||||||||||||||||||||||||||||||||||||||||||||||||||||||||||||||||||||||||||||||||||||||||||||||||||||||||||||||||||||||||||||||||||||||||||||||||||||||||||||||||
|
|
First Quarter |
Second Quarter |
Third Quarter | Fourth Quarter | Full Year | |||||
|
For the years ended December 31, |
1999 |
1998 |
1999 |
1998 |
1999 |
1998 |
1999 |
1998 |
1999 |
1998 |
|
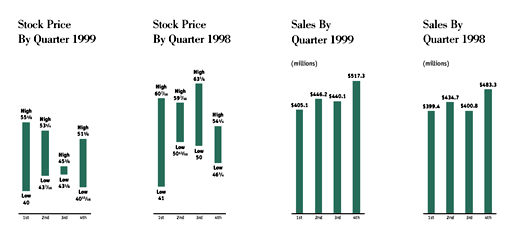
Sales |
$405.1
|
$399.4
|
$446.2
|
$434.7 | $440.1 | $400.8 | $517.3 | $483.3 | $1,808.7 | $1,718.2 |
| Cost of sales | 211.2 | 229.8 | 234.1 | 236.5 | 231.2 | 207.0 | 265.6 | 247.3 | 942.1 | 920.6 |
| Gross profit | 193.9 | 169.6 | 212.1 | 198.2 | 208.9 | 193.8 | 251.7 | 236.0 | 866.6 | 797.6 |
| Selling, general and administrative | 111.8 | 119.7 | 115.5 | 123.6 | 117.4 | 120.2 | 132.2 | 128.8 | 476.9 | 492.3 |
| Research and development | 38.8 | 41.6 | 42.5 | 42.2 | 42.0 | 41.2 | 50.1 | 46.4 | 173.4 | 171.4 |
| Restructure charge | | | | | | | (0.2) | 19.1 | (0.2) | 19.1 |
| Operating income | 43.3 | 8.3 | 54.1 | 32.4 | 49.5 | 32.4 | 69.6 | 41.7 | 216.5 | 114.8 |
| Earnings (loss) before income taxes | 25.1 | (12.4) | 38.1 | 14.0 | 35.2 | 20.4 | 56.3 | 24.6 | 154.7 | 46.6 |
| Net earnings (loss) | $ 17.1 | $ (8.4) | $ 25.9 | $ 9.5 | $ 24.4 | $ 13.9 | $ 38.6 | $ 18.5 | $ 106.0 | $ 33.5 |
| Basic earnings | ||||||||||
| (loss) per share | $ 0.60 | $(0.30) | $ 0.91 | $ 0.34 | $ 0.85 | $ 0.49 | $ 1.34 | $ 0.65 | $ 3.70 | $ 1.19 |
| Diluted earnings | ||||||||||
| (loss) per share | $ 0.58 | $ (0.30) | $ 0.87 | $ 0.32 | $ 0.82 | $ 0.47 | $ 1.30 | $ 0.63 | $ 3.57 | $ 1.14 |
| Dividends per share | $ 0.16 | $ 0.15 | $ 0.16 | $ 0.15 | $ 0.16 | $ 0.15 | $ 0.16 | $ 0.16 | $ 0.64 | $ 0.61 |
| Stock price High | $551/8 | $607/16 | $531/4 | $597/16 | $ 453/8 | $635/8 | $513/8 | $541/4 | $55 1/8 | $63 5/8 |
| Stock price Low | $40 | $41 | $437/16 | $5013/16 | $435/8 | $50 | $4015/16 | $461/4 | $40 | $41 |
|
Annual
Report 1999
|
|
©
1999 Beckman Coulter, Inc. - www.beckmancoulter.com
|