|
Financial Highlights |
 |
Duke Energy Corporation
|
   |
|
|
|
Years Ended December 31, |
|
In millions, except where noted |
|
1998 |
|
1997a |
|
1996a |
 |
| Operating Revenues |
$ |
17,610 |
$ |
16,309 |
$ |
12,302 |
| Earnings Before Interest and Taxes (EBIT) |
|
2,647 |
|
2,108 |
|
2,294 |
| Income Before Extraordinary Item |
|
1,260 |
|
974 |
|
1,091 |
| Net Income |
|
1,252 |
|
974 |
|
1,074 |
| Earnings Available for Common Stockholders |
|
1,231 |
|
902 |
|
1,030 |
 |
| Common Stock Data |
|
|
|
|
|
|
| Weighted Average Shares Outstanding |
|
361 |
|
360 |
|
361 |
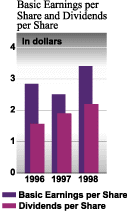
| Basic Earnings per Share |
|
|
|
|
|
|
| (before extraordinary item) |
$ |
3.43 |
$ |
2.51 |
$ |
2.90 |
| Basic Earnings per Share |
|
3.41 |
|
2.51 |
|
2.85 |
| Dividends per Share |
|
2.20 |
|
1.90 |
|
1.57 |
 |
| Capitalization |
|
|
|
|
|
|
| Common Equity |
|
49% |
|
50% |
|
51% |
| Preferred Stock |
|
2% |
|
3% |
|
5% |
| Trust Preferred Securities |
|
6% |
|
2% |
|
-- |
| Total Debt |
|
43% |
|
45% |
|
44% |
| SEC Fixed Charges Coverage |
|
4.7 |
|
4.1 |
|
4.3 |
 |
| Total Assets |
$ |
26,806 |
$ |
24,029 |
$ |
22,366 |
| Total Debt |
|
7,168 |
|
6,777 |
|
6,295 |
| Cash Flows from Operations |
|
2,331 |
|
2,140 |
|
2,335 |
| Capital and Investment Expenditures |
|
2,500 |
|
2,028 |
|
1,550 |
 |
| Operating Datab |
|
|
|
|
|
|
| Electric Operations Volumes, Sales -- GWh |
|
82,011 |
|
77,935 |
|
77,547 |
| Natural Gas Transmission Volumes, |
|
|
|
|
|
|
| Throughput -- TBtu |
|
2,593 |
|
2,862 |
|
2,939 |
| Natural Gas Marketed, TBtu/dc |
|
8.4 |
|
7.3 |
|
6.0 |
| Electricity Marketed, GWhd |
|
98,991 |
|
64,650 |
|
4,229 |
| Natural Gas Gathered and Processed/ |
|
|
|
|
|
|
| Transported, TBtu/d |
|
3.6 |
|
3.4 |
|
2.9 |
| Natural Gas Liquids Production, MBbl/d |
|
110.2 |
|
108.2 |
|
78.5 |
 |
| a |
Financial information reflects accounting for the 1997 merger with PanEnergy Corp as a pooling of interests. As a result, the financial information gives
effect to the merger as if it had occurred January 1, 1996. |
| b |
Units of measure used are gigawatt-hours (GWh), trillion British thermal units (TBtu), trillion British thermal units per day (TBtu/d) and thousand barrels
per day (MBbl/d), as applicable. |
| c |
Includes Trading and Marketing and Field Services volumes. |
|
d |
Excludes Electric Operations volumes. |
|
|
|
|