RESULTS OF OPERATIONS
The analysis that follows should be read in conjunction with
the tables below and the consolidated statements of earnings.
All amounts in the following tables are in thousands, except
as noted.
On May
1, 2001, the Company adopted a new methodology for allocation
of corporate services and support costs to business units.
The change was made to more accurately reflect the costs attributable
to each business segment. Fiscal year 2001 segment results
have been adjusted to reflect this allocation methodology.
Fiscal year 2000 has not been adjusted, as the effects of
the new methodology were not material to segment pretax earnings
or operating margins.

Fiscal
2002 compared to fiscal 2001
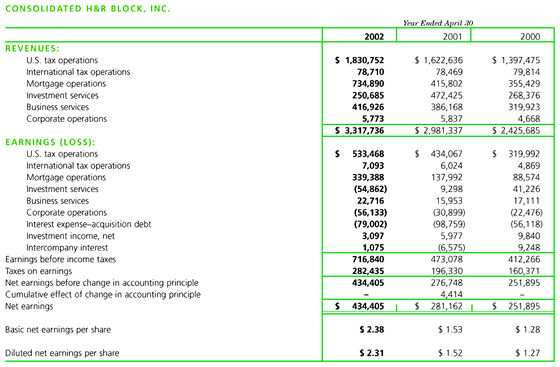
Consolidated revenues for fiscal year 2002 increased 11.3%
primarily due to increases in Mortgage operations and U.S.
tax operations. Mortgage operations and U.S. tax operations
increased revenues by $319.1 million and $208.1 million, respectively.
Also contributing to the increase was Business services, which
reported an 8.0% increase over the prior year. These increases
were partially offset by a decline in Investment services
revenues of $221.7 million.
The Company
reported pretax earnings of $716.8 million for fiscal year
2002 compared to $473.1 million in the prior year. The improvement
over the prior year is primarily from the Mortgage operations
segment that reported earnings of $339.4 million, a $201.4
million improvement over last year. In addition, U.S. tax
operations reported an improvement of 22.9% or $99.4 million
over the prior year. Somewhat offsetting these improvements
was a decline of $64.2 million from fiscal 2001 for Investment
services. In addition, the adoption of SFAS 141 and 142 positively
impacted the year-over-year pretax earnings increase by $62.4
million.
The effective income tax rate decreased from 41.5% last year
to 39.4% this year. The decrease in the effective tax rate
is primarily due to tax planning initiatives and the reduction
in non-deductible goodwill and other intangible asset amortization
related to the adoption of SFAS 141 and 142.
Net earnings
were $434.4 million, or $2.31 per diluted share compared to
earnings of $281.2 million, or $1.52 per diluted share for
the year ended April 30, 2001. The adoption of SFAS 141 and
142 improved net earnings over the prior year by $47.9 million,
or $.26 per diluted share.
The Company’s
performance as measured by earnings before interest (including
interest expense on acquisition debt, investment income and
interest allocated to operating business units), taxes, depreciation
and amortization (“EBITDA”) improved $165.2 million
to $952.4 million compared to $787.2 million in the prior
year. Management utilizes EBITDA to evaluate the performance
of its operating segments as an approximate measure of cash
flow generation. The Company’s operations have not historically
been capital intensive, and EBITDA also removes the effects
of purchase accounting. The calculation of EBITDA may not
be comparable to the calculation of EBITDA by other companies,
and it is a non-GAAP financial measure.
In addition,
the Company continues to measure its performance based on
the calculation of earnings excluding the after-tax impact
of amortization of acquired intangible assets. Net earnings,
excluding the after-tax impact of this expense, were $474.3
million, or $2.52 per diluted share in fiscal 2002, compared
to $366.6 million, or $1.98 per diluted share last year. This
calculation is a non-GAAP financial measure.
Fiscal
2001 compared to fiscal 2000
Consolidated revenues for fiscal year 2001 increased 22.9%
to $3.0 billion compared to $2.4 billion in the previous year
due primarily to increases in U.S. tax operations, Mortgage
operations and Investment services. The increase related to
Investment services is due to the inclusion of a full twelve
months of operations in fiscal 2001 compared to only five
months in fiscal 2000.
Pretax
earnings of $473.1 million increased 14.8% compared to fiscal
2000 due to improved performance within U.S. tax operations
and Mortgage operations, which were partially offset by lesser
performance within Investment services and higher interest
expense on acquisition debt.
The effective
tax rate increased from 38.9% to 41.5% in fiscal 2001 as a
result of a full year of non-deductible intangible asset and
goodwill amortization resulting from the acquisition of OLDE
Financial Corporation, compared with five months of amortization
in fiscal year 2000.
Net earnings
increased 11.6% to $281.2 million, or $1.52 per diluted share,
from $251.9 million, or $1.27 per diluted share in fiscal
2000. The Company’s fiscal 2001 results include two
one-time items — the implementation of SFAS 133, an
additional $.03 per diluted share, and an accrual for settlement
of litigation brought against the Company, a reduction of
$.05 per diluted share. Excluding the effects of these one-time
items, diluted earnings per share was $1.54, a 21.3% increase
over fiscal 2000.
The Company’s
performance as measured by EBITDA improved $189.2 million
to $787.2 million compared to $598.0 million in fiscal 2000.
Net earnings from continuing operations before change in accounting
principle, excluding the after-tax impact of amortization
of acquired intangible assets, were $362.2 million, or $1.96
per diluted share in 2001, compared to $304.4 million, or
$1.54 per diluted share in the prior year, increases of 19.0%
and 27.3%, respectively.
|