|
Letter from the Chairman and the Chief Executive Officer    1MB
In addition, you will find information about your company in the 2010 Proxy Statement and our quarterly letters to shareholders, as they become available. Together with the detailed analysis of the 2009 Annual Report on Form 10-K, these documents comprise a package of information similar to what appeared in our previous annual reports.
March 18, 2010
To Our Shareholders, Friends and Associates:
FINANCIAL REVIEW
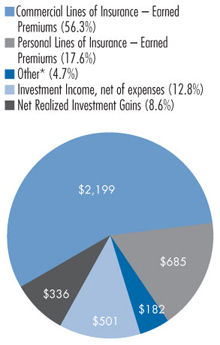
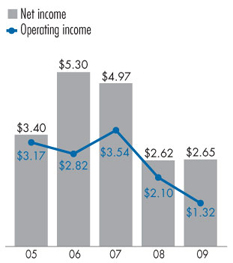
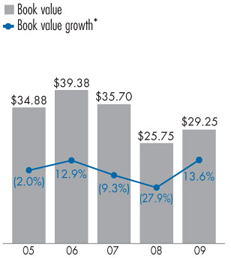
Your company reported $432 million of net income for 2009, up less than a percent from the 2008 result. Book value per share at December 31 reached $29.25, 14 percent above the year-end 2008 level. Property casualty surplus rose to $3.648 billion compared with $3.360 billion at year-end 2008. Shortly after our 2009 earnings announcements, A.M. Best affirmed its stable outlook and our A+ Superior insurer financial strength ratings, awarded to fewer than 11 percent of property casualty insurers. How we got to this point says much about your company and our cautious, fairly positive outlook on 2010 and beyond.
At the beginning of 2009, the crisis in the financial markets had taken its toll on our investment portfolio, reducing our income from stock dividends and our realized and unrealized investment gains. Broad economic weakness, together with a prolonged period of soft pricing for commercial insurance, pressured our premium revenues even as loss costs continued to rise. While our capital, liquidity, financial flexibility and capacity for future growth remained exceptionally strong, the declining profit trends were unsatisfactory. We had put our enterprise risk management program into high gear in mid-2008, working to identify specific metrics that define our risk tolerance and specific plans to stay inside their boundaries. In early 2009, many initiatives already were under way to stabilize and conserve our capital, drive growth of our insurance business and improve profitability. Our sense of urgency was strong. Nevertheless, by the end of the first quarter, high catastrophe losses led to a large underwriting loss for property casualty insurance operations. The declining trends continued for investment income, for the investment portfolio and for our property casualty surplus.
“ONE CARRIER OFFERED A CINCINNATI CLIENT COVERAGE AT A PREMIUM THAT WAS ALMOST 25 PERCENT LESS THAN CINCINNATI’S. THE CLIENT
DECIDED THAT HIS CLAIMS REPRESENTATIVE AND CINCINNATI WERE WORTH THE EXTRA COST, EVEN IN THESE TOUGH ECONOMIC TIMES.” —
From a North Carolina Agent
Page 1
The second quarter brought little relief. Book value and surplus rose on better securities valuations. However, higher pretax investment interest income only partially offset lower dividend income. High second-quarter catastrophe losses piled on top of the first-quarter losses, and we added to our reserves for prior period workers' compensation loss estimates. Fitch Ratings cited the unfavorable underwriting performance as it lowered our insurer ratings to A+(Strong), albeit raising the outlook to stable. We kept working on our initiatives. Solid earnings and favorable balance sheet trends emerged in the second half. By year-end, we were able to report three consecutive quarters of increasing assets, book value and statutory surplus, as well as two consecutive quarters of property casualty underwriting profit. Mild weather prevailed, partially offsetting the effects of continued price competition and lower payrolls and sales for businesses that pay premiums based on those measures. Securities valuations rose, and in the fourth quarter, pretax investment income resumed a growth trend. Property casualty operations, life operations, investment income and investment gains all contributed during the second half to the rise in book value. While we are not yet satisfied, improving trends have returned to your company.
Page 2
FOUNDATION FOR THE FUTURE
The insurance business is not for the faint-hearted who are distracted or discouraged by near-term events and results. Pushing negativity of the first half into the background, our leaders and associates kept in the foreground the initiatives that would position your company to grow profitably in years to come. Our 2009 progress was significant. CAPITAL:
"UPLOAD WITH CINCINNATI IS BY FAR THE SMOOTHEST PROCESS OF ALL OF
THE CARRIERS THAT OFFER IT TO US. I CAN COMPLETE SO MUCH MORE WORK
IN THE SAME TIMEFRAME." - From a Michigan Agent
AGENCY RELATIONSHIPS AND GROWTH:
PROFITABILITY:
We were buoyed by a strong sense of accomplishment even before the bad weather subsided in the third quarter. Most of the impacts from this work in 2009 will accumulate over time, increasing the stability of our investment and underwriting results and cementing the agent relationships that distinguish your company and help build long-term shareholder value. TRANSITIONS, CONTINUITY
AND STRATEGY
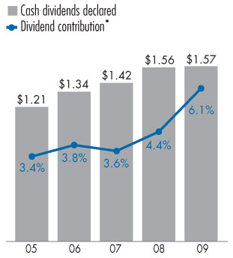
Your company's longstanding record of annual dividend increases is a key contributor to that shareholder value. As many public companies decreased or suspended their dividends in 2008 and early 2009, our board continued ours then acted in the third quarter of 2009 to increase it. Your new indicated annual dividend was $1.58 per share, up 2 cents, signaling the board's confidence in our financial strength and flexibility and management's ability to position the company for future performance. Page 4
"THE REASON THIS CLIENT WANTED
AN ANNUITY FROM CINCINNATI LIFE
RATHER THAN ANOTHER OF MY
CARRIERS IS HOW WELL THE CLIENT
HAD BEEN SERVED BY YOUR CLAIMS
REPRESENTATIVE DURING A
CATASTROPHE AND AUTO CLAIM."
- From an Ohio Agent
This action also signaled our values of consistency, predictability and a long-term perspective - values that create steadiness in our management of market cycles, trust in our insurance relationships with agents and policyholders and transparency in our communications with investors. Those are values that have characterized your company since its founding in 1950 by four independent agents. We regretfully note the passing in early 2010 of our last living founder, Bob Schiff. The composition of our board was unchanged in 2009, with a new independent director joining us early in 2010. Linda W. Clement-Holmes is a talented and high-achieving Procter & Gamble executive with extensive leadership experience in technology strategy, management and implementation. She brings expertise that complements that of other directors, rounding out our board. Linda is serving on a new, 14th board seat and on the board's independent audit committee. Our vice chairman and retired president, Jim Benoski is not standing for re-election at this year's annual meeting of shareholders, as previously announced. With his departure, the number of board seats will return to 13. Page 5
The board has approved our enterprise strategic plan for 2010. They will measure our success executing the plan in several ways. The value creation ratio is our primary measure of progress. We believe it captures the contribution of our insurance operations, the success of our investment strategy and the importance we place on paying cash dividends to shareholders. It has two components: 1) our rate of growth in book value per share plus 2) the ratio of dividends declared per share to beginning book value per share. For the period 2010 through 2014, we continue to target an annual value creation ratio averaging 12 percent to 15 percent. Several goals are the keys to increasing our book value and achieving that target: 1) year-over-year property casualty premium growth exceeding the industry average of our insurance business; 2) a combined ratio consistently under 100 percent; 3) total return on the equity portfolio exceeding total return on the S&P 500 Index; and 4) year-over-year growth of investment income. Those are ambitious goals, and we'll stretch to meet them. We will act in 2010 to manage capital, to make it easier for agents to do business with us and to enhance our ability to improve and sustain profitability. While many of the same initiatives described above are ongoing, some new initiatives are notable. "WE PLACED OUR FIRST BUSINESS
WITH CSU PRODUCER RESOURCES.
THE EASE OF DOING BUSINESS,
TIMELY RATING PROCESS AND
UNDERWRITER WERE ALL UP
TO CINCINNATI'S HIGH STANDARDS.
E&S FROM CINCINNATI WILL
DEFINITELY BE GOOD FOR AGENTS." - From a Florida Agent
MANAGING CAPITAL
We will again work to maintain a diversified investment portfolio, applying our risk management guidelines and balancing our needs for current income and long-term appreciation. We'll also further develop our comprehensive, enterprise-level catastrophe management program, including regional guidelines that work with our underwriting and reinsurance efforts. Page 6
EXCEEDING AGENT EXPECTATIONS
Our most important point of differentiation and competitive advantage is our agent relationships. Our 2010 emphasis is squarely on service, and on our commitment to make it easier for agents to do business with us. In 2010, we will develop short- and long-term technology plans, also gathering and acting on data that measures agent satisfaction with our systems and service. We will develop department level service improvement plans and customer service training programs for associates. We'll provide direct policyholder services that our agents say they want for their clients. By taking service to the next level, we aim to be the carrier of choice for each agency's best business. Page 7
"OUR CLIENT REVIEWED FOUR QUOTES THAT WERE LOWER IN PREMIUM,
BUT HE RENEWED WITH CINCINNATI BECAUSE OF HIS PAST CLAIM EXPERIENCE
AND THE LOSS CONTROL ASSISTANCE YOU HAVE PROVIDED. THE CLIENT
RECOGNIZED YOUR SERVICE AND THE VALUE IT ADDS" - From a Montana Agent
DRIVING GROWTH
To grow our insurance business, we will focus our resources on markets where our penetration is low and opportunities are high. We expect to appoint 65 new professional agencies in 2010, in a range of sizes and with aggregate annual premiums of about $1 billion with all carriers they represent. We will give our product portfolio attention, further broadening and diversifying the types of commercial products offered. IMPROVING PROFITABILITY
To sustain underwriting profitability through all cycles, we are continuing in 2010 to develop pricing capabilities for each line of business and remediation plans for each underperforming line of business. We also expect to develop more expertise for larger, complex risks. We'll reduce and manage expenses, moving toward operational budgets at the department level to help managers maximize use of resources. For each of these efforts, we'll provide improved management and associate training and establish metrics that ensure accountability. ACCOUNTABILITY
Our 2010 plans and metrics fully support accountability of executives to the board and shareholders, of managers to department heads and of associates to supervisors. Additionally, shareholders approved the Annual Incentive Compensation Plan of 2009 at last year's Annual Meeting of Shareholders. The board of directors recently adjusted the balance of compensation components for executive officers, implementing this plan that makes the vesting of awards contingent on attainment of specific company performance metrics. In turn, except in unusual circumstances, the executive officers no longer will receive nonperformance-based, discretionary bonuses that other associates continue to receive. Regardless of any economic upturn or market cycle changes that may or may not occur in 2010, we are confident in our ability to build on the improving trends and significant achievements of 2009. We thank our loyal shareholders for the opportunities to accomplish more for you in 2010. Respectfully,
Page 8
Condensed Balance Sheets and Income Statements
Page 9
Six-year Summary Financial Information
Page 10
This report contains forward-looking statements that involve potential risks and uncertainties. For factors that
could cause results to differ materially from those discussed, please see the most recent edition of our safe
harbor statement under the Private Securities Litigation Reform Act of 1995. To view or print the edition in
effect as of this report's initial publication date, please view this document as a printable PDF.
|
|||||||||||||||||||||||||||||||||||||||||||||||||||||||||||||||||||||||||||||||||||||||||||||||||||||||||||||||||||||||||||||||||||||||||||||||||||||||||||||||||||||||||||||||||||||||||||||||||||||||||||||||||||||||||||||||||||||||||||||||||||||||||||||||||||||||||||||||||||||||||||||||||||||||||||||||||||||||||||||||||||||||||||||||||||||||||||||||||||||||||||||||||||||||||||||||||||||||||||||||||||||||||||||||||||||||||||||||||||||||||||||||||||||||||||||||||||||||||||||||||||||||||||||||||||||||||||||||||||||||||||||||||||||||||||||||||||||||||||||||||||||||||||||||||||||||||||||||||||||||||||||||||||||||||||||||||||||||||||||||||||||||||||||||||||||||||||||||||||||||||||||||||||||||||||||||||||||||||||||||||||||||||||||||||||||||||||||||||||||||||||||||||||||||||||||||||||||||||||||||||||||||||||||||||||||||||||||||||||||||||||||||||||||||||||||||||||||||||||||||||||||||||||||||||||||||||||||||||||||||||||||||||||||||||||||||||||||||||||||||||||||||||||||||||||||||||||||||||||||||
|
Shareholder Information |
Financials & Analysis |
Business Information |
Ratings |
Electronic Delivery |
Investor Contacts |
Safe Harbor | Individuals & Families | Businesses & Organizations | Investors | Independent Agents | Career Seekers | Identity Protection, Phishing and Fraud Home Terms and Conditions Privacy Policies Copyright © 2010, Cincinnati Financial Corporation Investor Contacts |
|||||||||||||||||||||||||||||||||||||||||||||||||||||||||||||||||||||||||||||||||||||||||||||||||||||||||||||||||||||||||||||||||||||||||||||||||||||||||||||||||||||||||||||||||||||||||||||||||||||||||||||||||||||||||||||||||||||||||||||||||||||||||||||||||||||||||||||||||||||||||||||||||||||||||||||||||||||||||||||||||||||||||||||||||||||||||||||||||||||||||||||||||||||||||||||||||||||||||||||||||||||||||||||||||||||||||||||||||||||||||||||||||||||||||||||||||||||||||||||||||||||||||||||||||||||||||||||||||||||||||||||||||||||||||||||||||||||||||||||||||||||||||||||||||||||||||||||||||||||||||||||||||||||||||||||||||||||||||||||||||||||||||||||||||||||||||||||||||||||||||||||||||||||||||||||||||||||||||||||||||||||||||||||||||||||||||||||||||||||||||||||||||||||||||||||||||||||||||||||||||||||||||||||||||||||||||||||||||||||||||||||||||||||||||||||||||||||||||||||||||||||||||||||||||||||||||||||||||||||||||||||||||||||||||||||||||||||||||||||||||||||||||||||||||||||||||||||||||||||||