
3033 Campus Drive
Suite E490
Plymouth, MN 55441
763.577.2700 (phone)
800.918.8270 (toll-free)


Shareholder Return Information
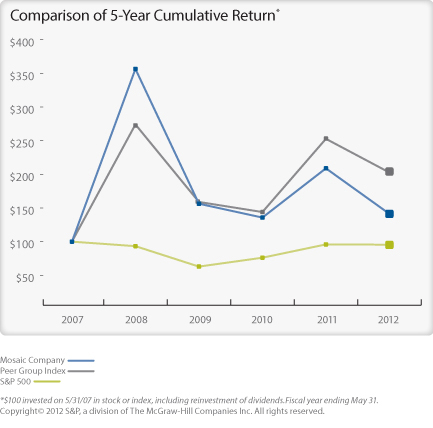
The performance graph compares the cumulative total return on our common stock for a period beginning May 31, 2007, with the cumulative total return of the Standard & Poor's 500 Stock Index, and a peer group of companies selected by us.
Our 2012 peer group is composed of Agrium Inc., CF Industries Holdings, Inc. and Potash Corporation of Saskatchewan Inc. Our stock price performance differs from that of our peer group during some periods due to differences in the market segments in which we compete or in the level of our participation in such segments compared to other members of the peer group. In accordance with Standard & Poor's policies, companies with less than a majority of their stock publicly traded are not included in the S&P 500 Index, and, accordingly, we were not included in the S&P 500 Index until September 23, 2012, on account of our former controlling stockholder. The comparisons set forth above assume an initial investment of $100 and reinvestment of dividends or distributions.
Stock Performance
Comparison of Cumulative Total Return Among The Mosaic Company, S&P 500 Index and Peer Group Index.