

COMPENSATION DISCUSSION AND ANALYSIS
| |||||||||||||||||||||||||||||||||||||||||||||||||||||||||||||||||||||||||||||||||||||||||||||||||||||||||||||||||||||||||||||
| COMPENSATION ELEMENT AND TYPE OF COMPENSATION | KEY OBJECTIVES | |
|---|---|---|
Base Salary
|
|
|
Annual Incentive Awards Results-Based Incentive (RBI)
|
|
|
Long-Term Incentive Equity Awards Restricted Stock
|
|
Our executives' total direct compensation reflects a mix of these three elements that meets our compensation objectives. These direct compensation elements are rounded out with certain perquisites and other executive benefits. See "Perquisites and Other Executive Benefits" on page 42. To reinforce the link with shareholders' interests, we require our executives to own a meaningful amount of stock.
OUR 2016 PERFORMANCE
In 2016, Raytheon continued to execute our growth strategy and deliver strong program performance while also maintaining strong operating margins. Our global team built upon Raytheon's return to growth in 2015, driven by increases in both domestic and international sales. 2016 was the 13th consecutive year of international sales growth, which reflects the continued successful evolution and execution of our international strategy. Highlights of our 2016 performance include:
These achievements led us to exceed our 2016 targets on three out of four RBI metrics and all LTPP metrics, resulting in the funding levels shown below.
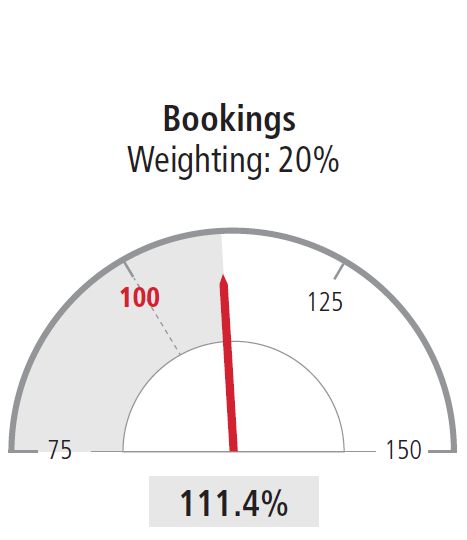
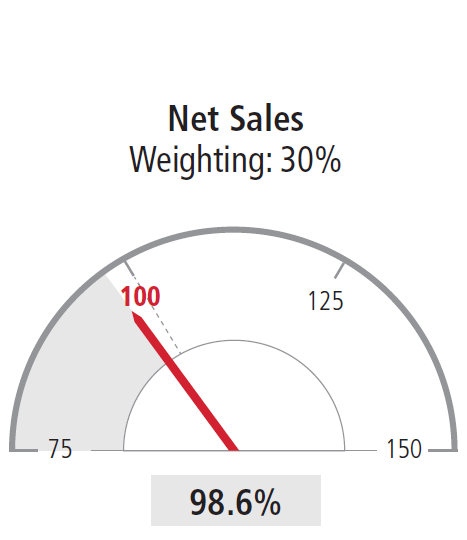
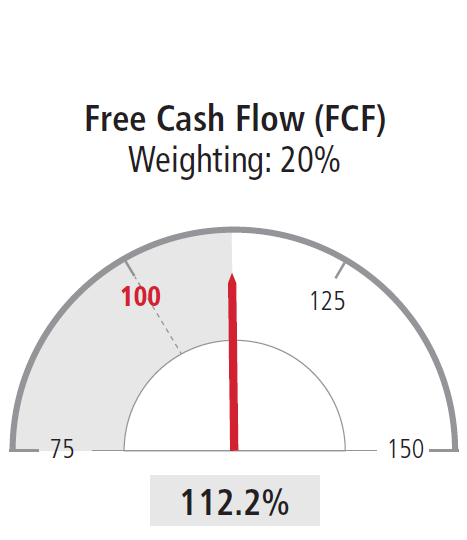
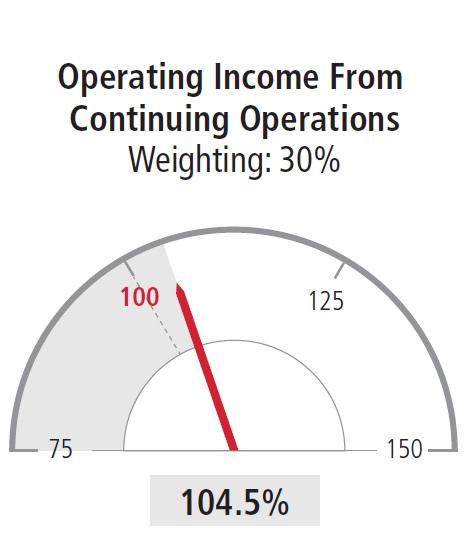
For complete information, see "Executive Compensation in 2016 - Annual Cash Incentives - RBI" on page 36.
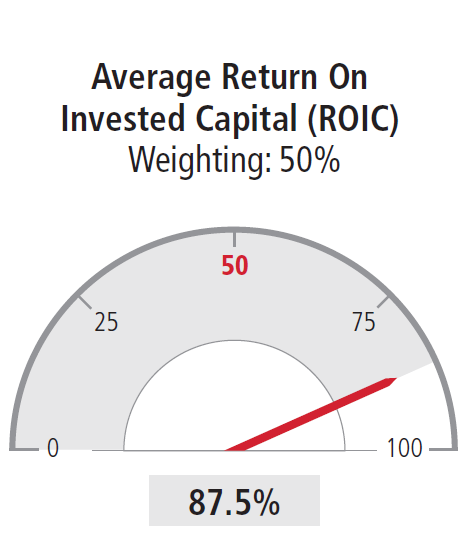
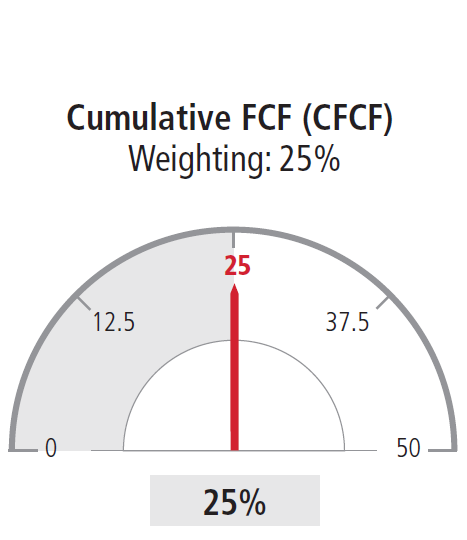
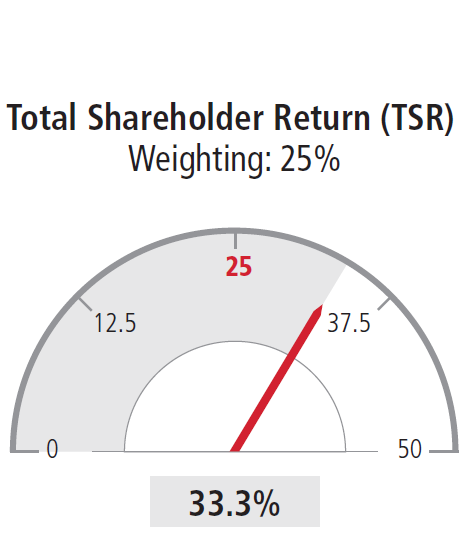
For complete information, see “Executive Compensation in 2016 - Long-Term Equity Incentives - LTPP and Restricted Stock” on page 40.
2016 TOTAL DIRECT COMPENSATION
The table below shows the base salary earned, annual cash incentive paid, and equity awards granted to our NEOs for 2014- 2016 for Messrs. Kennedy, Wajsgras and Yuse; and for 2015-2016 for Messrs. O'Brien and Lawrence, who became NEOs in 2015. This supplemental information is not a substitute for the information appearing in the Summary Compensation Table on page 47.
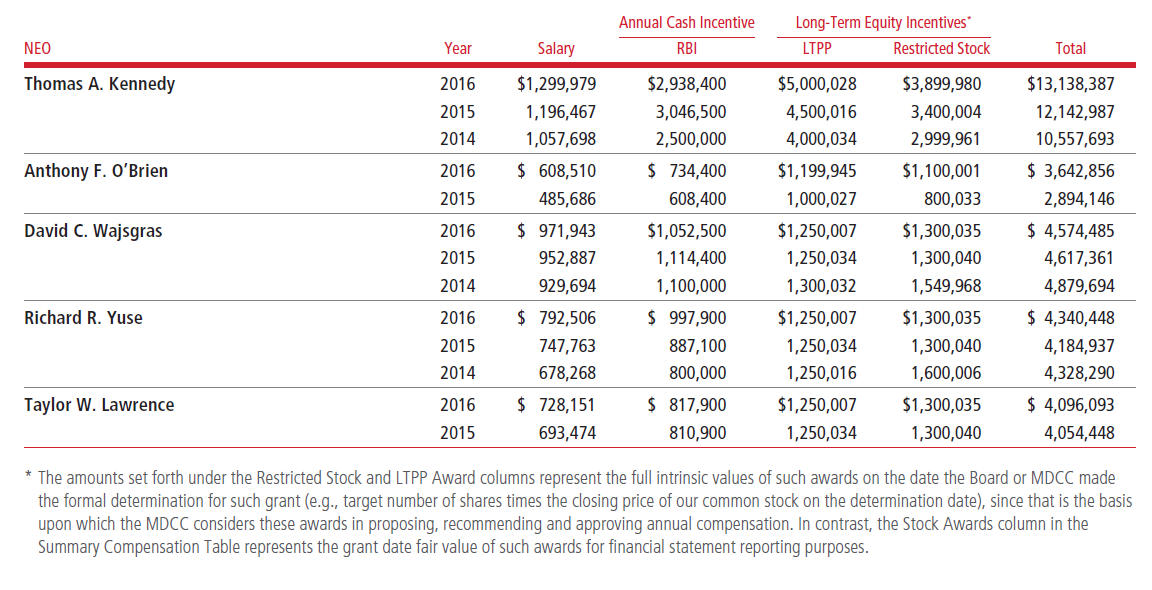
| Annual Cash Incentive | Long-Term Equity Incentives* | ||||||
| NEO | Year | Salary | RBI | LTPP | Restricted Stock | Total | |
| Thomas A. Kennedy | 2016 | $1,299,979 | $2,938,400 | $5,000,028 | $3,899,980 | $13,138,387 | |
| 2015 | 1,196,467 | 3,046,500 | 4,500,016 | 3,400,004 | 12,142,987 | ||
| 2014 | 1,057,698 | 2,500,000 | 4,000,034 | 2,999,961 | 10,557,693 | ||
| Anthony F. O'Brien | 2016 | $608,510 | $734,400 | $1,199,945 | $1,100,001 | $3,642,856 | |
| 2015 | 485,686 | 608,400 | 1,000,027 | 800,033 | 2,894,146 | ||
| David C. Wajsgras | 2016 | $971,943 | $1,052,500 | $1,250,007 | $1,300,035 | $4,574,485 | |
| 2015 | 952,887 | 1,114,400 | 1,250,034 | 1,300,040 | 4,617,361 | ||
| 2014 | 929,694 | 1,100,000 | 1,300,032 | 1,549,968 | 4,879,694 | ||
| Richard R. Yuse | 2016 | $792,506 | $997,900 | $1,250,007 | $1,300,035 | $4,340,448 | |
| 2015 | 747,763 | 887,100 | 1,250,034 | 1,300,040 | 4,184,937 | ||
| 2014 | 678,268 | 800,000 | 1,250,016 | 1,600,006 | 4,328,290 | ||
| Taylor W. Lawrence | 2016 | $728,151 | $817,900 | $1,250,007 | $1,300,035 | $4,096,093 | |
| 2015 | 693,474 | 810,900 | 1,250,034 | 1,300,040 | 4,054,448 | ||
* The amounts set forth under the Restricted Stock and LTPP Award columns represent the full intrinsic values of such awards on the date the Board or MDCC made the formal determination for such grant (e.g., target number of shares times the closing price of our common stock on the determination date), since that is the basis upon which the MDCC considers these awards in proposing, recommending and approving annual compensation. In contrast, the Stock Awards column in the Summary Compensation Table represents the grant date fair value of such awards for financial statement reporting purposes.