Pre-K–12 Education: Market, Adoption States, Open Territories, and Supplemental Sales
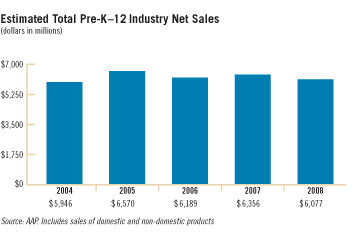
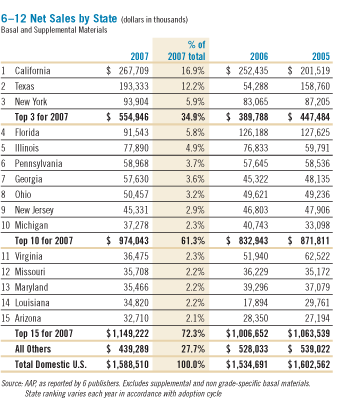
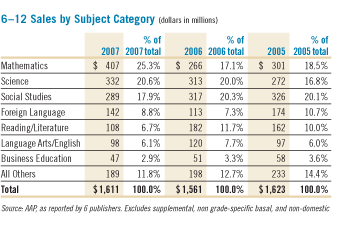
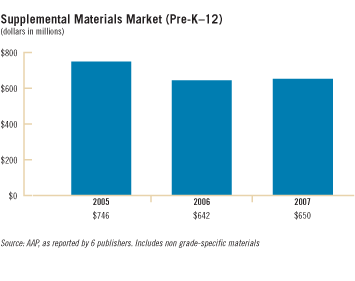
In 2008, sales of textbooks and educational materials for the pre-K–12 school market decreased 4.4% to $6.1 billion, according to the Association of American Publishers (AAP).
Growing Enrollments in Key Adoption States
Changing U.S. Pre-K–12 Enrollment by Region and State, 2005-2017
Mapping the Adoption Process
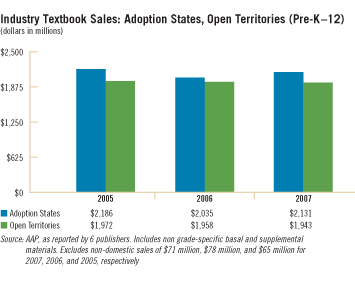
In the adoption process, a state education board selects elementary and secondary textbooks to be placed on an approved list. To use state education funds, local school districts must choose textbooks from the approved list. In adoption states, the state board issues curriculum guidelines and schedules the purchase of new books in each subject area. In the remaining states, known as “open territories,” textbooks are purchased independently by local school districts or individual schools. There are no statewide purchasing schedules or state selected lists of textbooks.
- Adoption States (20 States):
States in which school districts must purchase educational materials that have been “adopted” at the state level in order to qualify for state funding. - Open Territories (30 States):
States in which schools purchase educational materials independently.
Notes:
California: Adopts for grades K–8; grades 9–12 are open territory
Utah and Oregon: Issue state-recommended lists, but do not tie textbook purchases to funding
Total U.S. Enrollment
Growth: 10.0%
Between 2005 and 2017 enrollment in public elementary and secondary schools
is projected to increase in 37 states
as well as the District of Columbia and
decline in 13 states, translating into a 10.0% national increase in public
school enrollment overall.
Projected Enrollment Growth in Key Adoption States, 2005-2017
| Texas | 32.9% |
| Florida | 28.9% |
| North Carolina | 23.1% |
| Virginia | 13.0% |
| California | 8.7% |
Source: U.S. Department of Education, National Center for Education Statistics, “Projections of Education Statistics to 2017”
