1998 Annual Report --
Contents || Corporate Listings

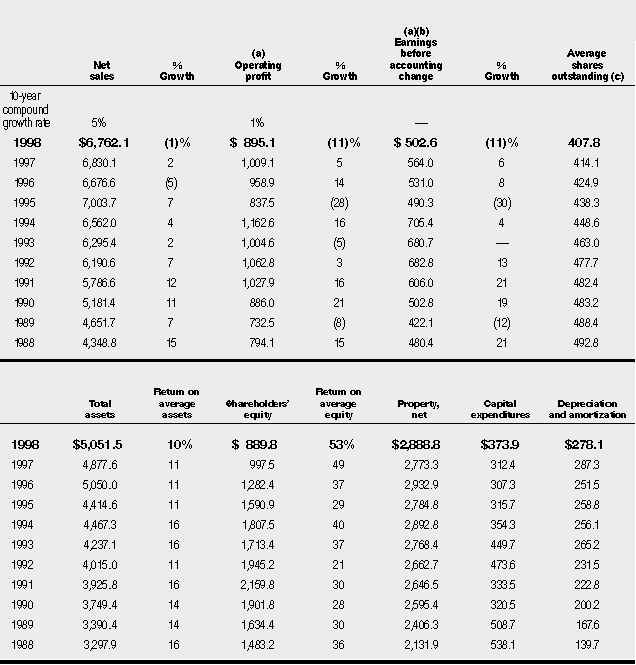
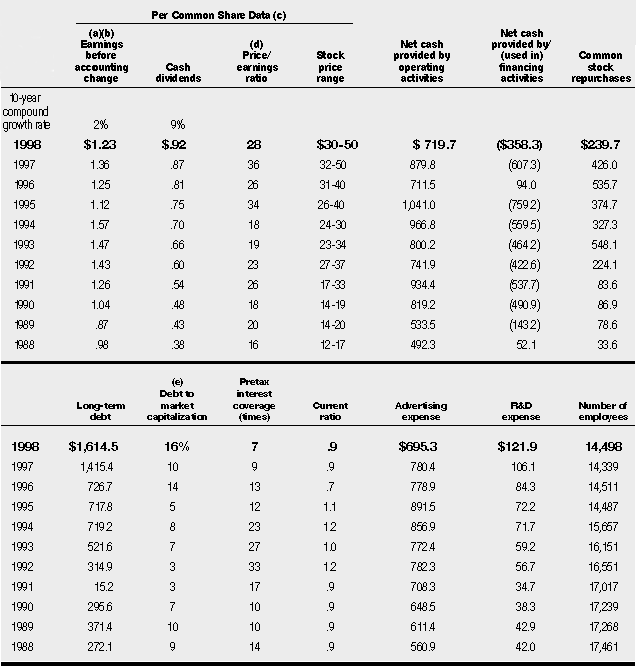
(a) Operating profit for 1998 includes non-recurring charges of $70.5 ($46.3 after tax or $.12 per share). Operating profit for 1997 includes non-recurring charges of $184.1 ($140.5 after tax or $.34 per share). Operating profit for 1996 includes non-recurring charges of $136.1 ($97.8 after tax or $.23 per share). Earnings before accounting change for 1996 include a charge of $35.0 ($22.3 after tax or $.05 per share) for a contribution to the Kellogg's Corporate Citizenship Fund. Operating profit for 1995 includes non-recurring charges of $421.8 ($271.3 after tax or $.62 per share). Operating profit for 1993 includes non-recurring charges of $64.3 ($41.1 after tax or $.09 per share). Refer to Management's Discussion and Analysis on pages 16-21 and Notes 3 and 4 within the Notes to Consolidated Financial Statements for further explanation of non-recurring charges and other unusual items for years 1996-1998.
(b) Earnings before accounting change for 1997 exclude the effect of a charge of $18.0 after tax ($.04 per share) to write off business process reengineering costs in accordance with guidance issued by the Emerging Issues Task Force of the FASB. Earnings before accounting change for 1992 and 1989 exclude the effect of adopting the following Statements of Financial Accounting Standards (SFAS): in 1992, a charge of $251.6 ($.53 per share) net of $144.6 of income tax benefit for the transition effect of SFAS #106, "Employers' Accounting for Postretirement Benefits Other Than Pensions," and, in 1989, a gain of $48.1 ($.10 per share) for SFAS #96 "Accounting for Income Taxes."
(c) All share data retroactively restated to reflect 2-for-1 stock splits in 1997 and 1991. All earnings per share data represent both basic and diluted earnings per share.
(d) The price/earnings ratio was calculated based on year-end stock price divided by earnings before the accounting changes referred to in note (b). These earnings include the non-recurring charges and other unusual items referred to in note (a). Excluding the impact of these unusual items, the price/earnings ratio in 1998, 1997, 1996, 1995, and 1993 would have been 25, 29, 21, 22, and 19, respectively.
(e) Debt to market capitalization was calculated based on year-end total debt balance divided by market capitalization. Market capitalization was calculated based on year-end stock price multiplied by the number of shares outstanding at year-end.