Asset Classes
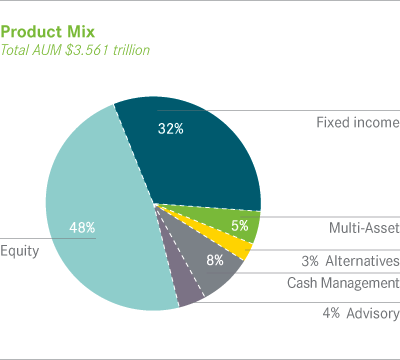
At year-end 2010, products invested primarily in long-term assets represented 88% of total AUM or $3.131 trillion, of which 54% were equity mandates, 36% fixed income accounts, 6% multi-asset class portfolios and 4% alternative investments. The remaining AUM was in cash management products and advisory mandates. Net new business in long-term products totaled $131.2 billion, before giving effect to merger-related outflows. Net inflows in long-term products were offset by net outflows in cash management products, as money market fund yields remained near zero and net distributions from advisory portfolios.
Equity and Fixed Income
 Equity and fixed income AUM include a wide range of active and passive strategies. In total, equity AUM increased $158.4 billion or 10% to $1.694 trillion at year-end 2010. Growth was driven by $69.1 billion of net new business and $197.1 billion of investment performance and market appreciation. Fixed income AUM ended 2010 at $1.141 trillion, up $85.7 billion or 8% relative to December 31, 2009. Net new business contributed $36.0 billion of the growth, while markets and investment performance contributed $66.1 billion. Merger-related outflows totaled $99.4 billion and $19.9 billion in equities and fixed income, respectively, primarily due to manager concentration and underperformance in scientific active equities. (See additional discussion under "Investment Styles".)
Multi-Asset Class
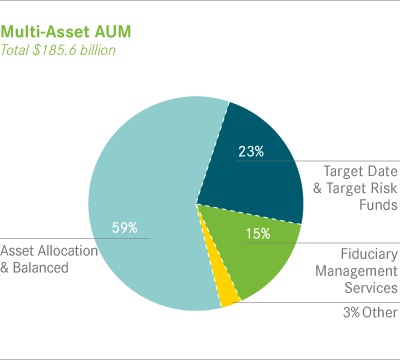
BlackRock's multi-asset class AUM ended 2010 at $185.6 billion, an increase of 31% or $43.6 billion. During the year, we were awarded $26.3 billion of net new business and portfolio values rose $13.9 billion. BlackRock's multi-asset class team manages a variety of bespoke mandates that leverage our broad investment expertise in global equities, currencies, bonds and commodities and our extensive risk management capabilities. Investment solutions might include a combination of long-only portfolios and alternative investments, as well as tactical asset allocation overlays. The products are described briefly below.
 BlackRock's multi-asset class products were managed on behalf of a well-balanced client base. At December 31, 2010, institutional investors represented 56% of multi-asset class AUM, while retail and high net worth investors accounted for 44%. Flows were almost evenly split as well, with $15.3 billion or 59% and $10.7 billion or 41% coming from institutional and retail and high net worth investors, respectively. The geographic mix was similarly diversified, with 59% of multi-asset class AUM managed for clients based in the Americas, 32% in EMEA and 9% in Asia-Pacific. During the year, clients in the Americas and EMEA awarded BlackRock net new business of $26.6 billion, which offset net outflows of $0.5 billion from clients in Asia-Pacific.
- Asset allocation and balanced products represented 59% or $109.8 billion of multi-asset class AUM at year-end, up $23.0 billion on the strength of net new business of $14.0 billion and favorable investment performance and market movements of $9.0 billion. Our industry leading global allocation funds surpassed $70 billion in AUM in 2010.
- Target date and target risk funds ended the year at $41.9 billion, or 23% of multi-asset class AUM, driven by net inflows of $7.5 billion, a year-over-year organic growth rate of 26% and portfolio appreciation of $4.5 billion. Products include our LifePath® and LifePath Retirement Income offerings, which are Qualified Default Investment Alternatives under the Pension Protection Act of 2006. These products utilize a proprietary asset allocation model that seeks to balance risk and return over an investment horizon based on the investor's expected retirement timing.
- Fiduciary management services accounted for 15% or $28.6 billion of multi-asset class AUM at December 31, 2010. AUM increased $4.1 billion during the year. These are complex mandates in which pension plan sponsors retain BlackRock to assume responsibility for some or all aspects of plan management. Customized services include tailoring investment strategy to client-specific risk budgets and return objectives, working closely with the client's investment staff and trustees.
Volatile investor sentiment presented challenges for asset allocation strategies in 2010. While 35% of multi-asset class AUM achieved returns above their benchmarks or peer medians for the one year, longer-term results remained strong, with 81% of multi-asset class AUM outperforming for the three years and 87% for the five years ended December 31, 2010.
Alternative Investments
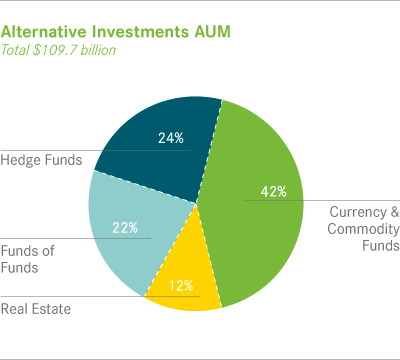 BlackRock ended 2010 with $109.7 billion of AUM in its alternative investment products, an increase of $7.6 billion. Net outflows totaled $0.1 billion, as withdrawals and disbursements in real estate, currency and opportunistic funds were offset by inflows in single- and multi-strategy hedge funds, global macro funds, funds of hedge funds and commodity products. We believe that as investors adapt their asset allocation strategies to best meet their investment objectives in the current environment, they will continue to increase their use of alternative investments to complement their core holdings.
The alternative investment client base was predominantly institutional, representing 75% or $81.8 billion of alternatives AUM with retail and high net worth investors comprising 8% or $9.3 billion of AUM at December 31, 2010. iShares comprised $18.6 billion or 17% of ending AUM. The geographic mix was well diversified, with 55% of AUM managed for clients in the Americas, 24% for clients in EMEA and 21% for clients in Asia-Pacific.
During 2010, we launched BlackRock Alternative Investors ("BAI") to coordinate our alternative investment efforts, including product management, business development and client service. The products offered under the BAI umbrella are described below.
- Real estate debt and equity products managed by BlackRock totaled $12.9 billion at year-end. Offerings include high yield debt and core, value-added and opportunistic equity portfolios. Real estate AUM decreased $5.5 billion during the year, driven by $3.3 billion in net outflows and $2.2 billion in market declines. Market performance rebounded for U.S. funds in 2010 and showed continued strength in the U.K. and within separate accounts.
- Funds of funds AUM increased $1.8 billion or 8% to $23.9 billion at December 31, 2010, including $18.5 billion in funds of hedge funds and hybrid vehicles and $5.4 billion in private equity fund of funds. During the year, growth was driven by net inflows of $0.5 billion and $1.3 billion of investment and market performance. Performance was strong and a growing number of institutional clients worldwide sought our expertise in customized accounts and commingled vehicles.
- Hedge funds ended the year with $25.9 billion of AUM in a variety of single-strategy, multi-strategy and global macro hedge funds, as well as portable alpha, distressed and opportunistic offerings. Products include both open-end hedge funds and similar products and closed-end funds that have been created to take advantage of specific opportunities over a defined, often longer-term investment horizon. Growth of $1.1 billion primarily came from $0.6 billion of net inflows into fixed income and multi-strategy hedge funds and strong investment and market performance of $1.8 billion across all strategies.
- Currency and commodity mandates totaled $45.6 billion at year-end 2010. These products include a range of active and passive products primarily managed through institutional separate accounts. AUM increased $10.0 billion during the year, driven by $2.8 billion of net inflows, primarily in commodities and currency overlays and $7.1 billion of market appreciation. Our iShares commodities products represented $18.6 billion of AUM, which are not eligible to pay performance fees.
Cash Management and
Securities Lending
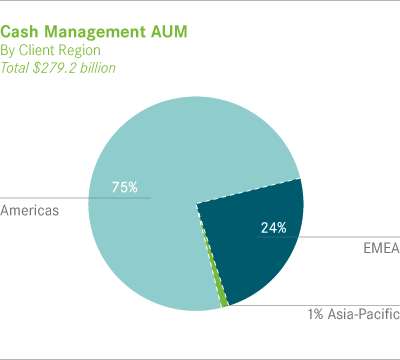 AUM in cash management products totaled $279.2 billion at December 31, 2010, a decrease of $70.1 billion, or 20%, from AUM reported at year-end 2009. Investors continued to look for higher returns by reallocating balances to deposits and operations and to a lesser extent, longer-term investment products. Cash management products include taxable and tax-exempt money market funds and customized separate accounts. Portfolios may be denominated in U.S. dollar, euro or pound sterling.
Our cash management clientele is largely institutional, with 85% of cash AUM managed for institutions and 15% for retail and high net worth investors at year-end 2010. The investor base was also predominantly domestic, with 75% managed for investors in the Americas and 25% for clients in other regions, almost all EMEA-based. We suffered net outflows during the year, as investors sought higher yields in bank deposits, direct money market investments and as they became more confident of the market recovery, in longer-term assets. Clients also used their cash for operating purposes, as business investment increased and merger and acquisition activity increased. We expect these trends to continue, which will continue to put pressure on cash management flows.
The cash management team also invests the cash we receive as collateral for securities on loan in other portfolios. Securities lending, which is offered as a potential source of incremental returns on long-term portfolios, is managed by a dedicated team, supported by quantitative analysis, proprietary technology and disciplined risk management. Fees for securities lending can be structured as a share of earnings and/or a percentage of the value of the cash collateral. The value of the securities on loan and the revenue earned is captured in the corresponding asset class in AUM. The value of the cash or securities collateral is not included in cash management AUM.
BlackRock employs a conservative cash management investment style that emphasizes quality, liquidity and superior client service throughout all market cycles.
The combination of the legacy businesses, along with the addition of new lending mandates, has increased lendable inventory and solidified BlackRock as a top tier provider of lendable assets. Outstanding loan balances ended the year at approximately $104 billion, down slightly from $111 billion at year-end 2009. Balance volatility throughout 2010 was lower than in recent years. Demand remained weak, as relatively few securities command premium lending fees. This trend is expected to continue through 2011, with a turnaround occurring when the end-borrowers of securities begin re-risking and putting their capital to work with more conviction.
BlackRock employs a conservative investment style that emphasizes quality, liquidity and superior client service throughout all market cycles. Disciplined risk management, including a rigorous credit surveillance process, is an integral part of the investment process. BlackRock's Cash Management Risk Committee has established risk limits, such as aggregate issuer exposure limits and maturity limits, across many of the products BlackRock manages, including over all of its cash management products. In the ordinary course of our business, there may be instances when a portfolio may exceed an internal risk limit or when an internal risk limit may be changed and no such instances, individually or in the aggregate, have been material to the Company. To the extent that daily evaluation/reporting of the profile of the portfolios identifies that a limit has been exceeded, the relevant portfolio will be adjusted. To the extent a portfolio manager would like to obtain a temporary waiver of a risk limit, the portfolio manager must obtain approval from the credit research team, which is independent from the cash management portfolio managers. While a risk limit may be waived, such temporary waivers are infrequent.
* Important Notes
On December 1, 2009, BlackRock acquired from Barclays Bank PLC all of the outstanding equity interests of subsidiaries of Barclays conducting the business of Barclays Global Investors ("BGI") ("the BGI Transaction").
Unless stated otherwise, net new business figures are before giving effect to merger related outflows resulting from manager concentration considerations and scientific active equity performance totaling $121.0 billion, or 7%, of the $1.8 trillion of AUM acquired in the BGI Transaction — well within overall tolerances in BlackRock's valuation model.
Past performance is not indicative of future results. The performance information for actively managed accounts reflects U.S. open-end and closed-end mutual funds and similar EMEA-based products with respect to peer median comparisons, and actively managed institutional and high net worth separate accounts and funds located globally with respect to benchmark comparisons, as determined using objectively based internal parameters, using the most current verified information available as of December 31, 2010. Accounts terminated prior to December 31, 2010 are not included. If such terminated and other accounts had been included, the performance information may have substantially differed from that shown. The performance information does not include funds or accounts that are not measured against a benchmark, private equity products, CDOs, or accounts managed by BlackRock's Financial Markets Advisory Group. Comparisons are based on gross-of-fee performance for U.S. retail, institutional and high net worth separate accounts and EMEA institutional separate accounts and net of fee performance for EMEA based retail products. The performance tracking information for institutional index accounts is based on gross-of-fee performance as of December 31, 2010, and includes all institutional accounts globally using an index strategy. AUM information is based on AUM for each account or fund in the asset class shown without adjustment for overlapping management of the same account or fund, as of December 31, 2010. Source of performance information and peer medians is BlackRock, Inc. and is based in part on data from Lipper Inc. for U.S. funds and Morningstar, Inc. for non-U.S. funds. Fund performance reflects the reinvestment of dividends and distributions, but does not reflect sales charges.
S&P 500® Index is a widely recognized, unmanaged index of common stock prices of industrial, utility, transportation and financial companies in U.S. markets.
Barclays Capital U.S. Aggregate Index is an unmanaged index considered representative of the U.S. investment-grade, fixed-rate bond market.
These opinions, expressed through page 40 of the 2010 BlackRock Annual Report, are those of BlackRock, Inc. as of April 2011 and are subject to change.
This is an interactive electronic version of the BlackRock 2010 Annual Report to Shareholders. The contents of this version are qualified in their entirety by reference to the printed version. A reproduction of the printed version is available in PDF in the "Investor Relations" section on this Web site.