Investment Styles
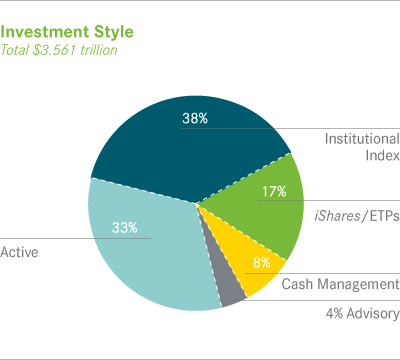
Long-term product offerings include active and passive (index) strategies. The investment objective for active portfolios is to earn attractive returns in excess of a market benchmark or performance hurdle (alpha). In contrast, passive strategies seek to closely track the returns of the corresponding index (beta), generally by investing in the securities that comprise the index or in a subset of those securities selected to approximate the risk and return profile of the index. BlackRock's acquisition of Barclays Global Investors included an at-scale index business that materially changed BlackRock's AUM mix. Index AUM, including institutional and iShares products, increased from 4% of AUM at year-end 2008 (prior to the BGI Transaction) to 54% of AUM at December 31, 2010.
Although many clients use both active and passive strategies, the profile of these assets differs greatly. For example, clients often use index products to gain exposure to a market or asset class pending reallocation to an active manager. This has the effect of increasing turnover on index AUM. In addition, institutional index assignments tend to be very large (multi-billion dollars) and priced at low fee rates. This has the effect of exaggerating the significance of net flows in institutional index on BlackRock's earnings.
Active Strategies
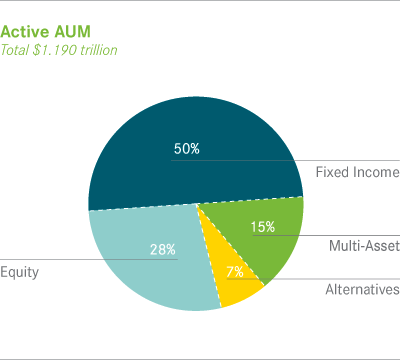
We offer two types of active strategies: those that rely primarily on fundamental research and those that utilize primarily quantitative models to drive security selection and portfolio construction. At year-end 2010, active long-term AUM increased $18.0 billion to $1.190 trillion at year-end, of which 28% was in equities, 50% in fixed income, 15% in multi-asset and 7% in alternatives. Favorable markets contributed $89.4 billion of growth, which was slightly offset by $2.0 billion of net outflows. AUM growth was significantly hampered by merger-related outflows of $64.6 billion, primarily in scientific active equities ("SAE").
Active Equity
 BlackRock's active equity AUM closed the year at $334.5 billion, a decline of 4%, or $14.0 billion relative to year-end 2009. Net new business contributed $2.6 billion of growth, while investment and market performance added $41.7 billion. A wide variety of products are offered, including global and regional portfolios; value, growth and core products; large, mid and small cap strategies; and selected sector funds. We believe an improving U.S. economy, strong corporate balance sheets, and sustained strong growth in the emerging markets bodes well for equity markets in 2011, although geopolitical risk remains a potential drag on investor sentiment.
BlackRock manages active equity portfolios for a diverse base of institutional and retail and high net worth investors globally. At December 31, 2010, approximately half of active equity AUM ($165.8 billion) was managed on behalf of institutional investors in separate accounts, collective investment trusts and mutual funds and half ($168.7 billion) for retail and high net worth investors, largely through open-end mutual funds and separately managed accounts. Approximately 46% of our active equity AUM was managed for investors based in the Americas, 39% in EMEA and 15% in Asia-Pacific.
- Fundamental active equity ended 2010 with $239.1 billion in AUM. Net inflows of $3.9 billion in equity dividend, global, European and other regional strategies were offset by outflows of $0.2 billion in U.S. equity funds. Market appreciation of $30.4 billion bolstered AUM as equity markets rebounded late in the year. BlackRock's fundamental active equity investors seek to add value relative to a specified index or on an absolute basis primarily through security selection based on proprietary research and portfolio manager judgment. Performance was strong in European and emerging market products, as well as selected sector funds including: energy, natural resources and health sciences. In total, 62%, 65% and 77% of fundamental active equity AUM beat their benchmarks or peer medians for the one-, three- and five-year periods ended December 31, 2010, respectively. During the year, we drew on existing talent to fill out the leadership team and attracted an experienced CIO for our U.S. fundamental active equity strategies.
- Scientific active equity AUM declined 32% to $95.4 billion. Portfolio appreciation of $11.4 billion was insufficient to overcome BGI merger-related outflows of $52.6 billion, much of which was anticipated due to underperformance dating back to 2007 in key developed market products. SAE strategies seek superior investment outcomes through a stock selection process that aims to systematically find and exploit pricing opportunities, while rigorously managing risk and cost. During the year, we appointed a new head of the SAE business, who reorganized the team and instilled a strong performance culture that has begun to stabilize the asset base. Though still nascent, there are early signs of improvement, as 55%, 45% and 36% of SAE AUM outperformed their benchmarks or peer medians for the one-, three- and five-year periods ended December 31, 2010, respectively.
Active Fixed Income
 BlackRock's active fixed income AUM ended 2010 at $592.3 billion, a slight decrease of 1% or $3.3 billion, from the previous year's results. During the year, we had $22.1 billion of net outflows, partially offset by $32.3 billion of investment and market performance. Fixed income mandates are often tailored to client-specified liabilities, accounting, regulatory or rating agency requirements, or other investment policies. U.S. bonds enjoyed good absolute returns in 2010. Despite a slight pullback during the fourth quarter, the Barclays Capital U.S. Aggregate Index* returned 6.5% for the year. While sovereign credit risk remains a concern, particularly in parts of Europe, inflation is not expected to have a material impact on Federal Reserve policy in 2011.
Of BlackRock's total active fixed income AUM, 82% was managed on behalf of institutional investors and 18% for retail and high net worth investors. The client base reflects our historical roots, with 69% of active fixed income AUM managed for investors in the Americas, 23% for EMEA domiciled clients, and 8% for investors in the Asia-Pacific region. Net inflows of $1.3 billion from Asia-Pacific clients were more than offset by outflows of $23.4 billion from investors in the Americas and EMEA.
- Fundamental fixed income AUM totaled $553.5 billion, or 93% of active fixed income AUM, at year-end 2010. These products emphasize risk-controlled sector rotation and security selection driven by sector experts and direct interaction with issuers and market makers. Fundamental strategies experienced net outflows of $10.2 billion largely driven by client changes in overall asset allocation and long-term performance concerns. In addition, $8.8 billion of fixed income assets, on which we have been waiving fees for more than a year, transferred to cash management. Market appreciation contributed $30.5 billion to ending AUM. Positive flows in U.S. municipal bonds of $2.0 billion were buoyed by the successful launch of the $1.2 billion Build America Bond Trust in the third quarter of the year. Fundamental taxable fixed income strategies achieved strong performance in 2010, with 72%, 49% and 49% of AUM above their benchmarks or peer medians for the one-, three-, and five-year periods ended December 31, 2010, respectively.
- Model-driven fixed income AUM declined $3.9 billion or 9%, ending the year at $38.8 billion. Investment and market performance of $1.7 billion was insufficient to overcome $3.2 billion of outflows. These strategies employ models to identify relative return opportunities and to apply those results, subject to a pragmatic review of model risk, on a systematic basis across portfolios. Performance in our model-driven fixed income strategies was mixed, with 66%, 81% and 92% of AUM above their benchmarks or peer medians for the one-, three- and five-year periods ended December 31, 2010, respectively.
Multi-Asset and Alternatives
Virtually all (98%) of AUM in multi-asset class mandates, and the majority (75%) of AUM in alternative investments are managed in active strategies. These products are discussed earlier. (See the corresponding sections under "Asset Classes".)
Institutional Index
 Institutional index AUM, generally managed in common trust funds or separate accounts, comprised 38% of total AUM at December 31, 2010. AUM growth was driven by net new business of $89.2 billion and market appreciation of $143.9 billion. Merger-related outflows of $55.3 billion were concentrated among a relatively small number of clients. Where possible, we worked with these investors to address manager concentration issues by reallocating commoditized, low fee AUM, while retaining significant relationships and opportunities.
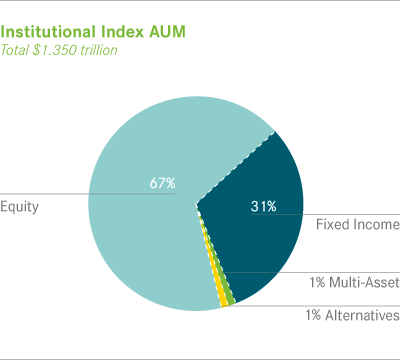
- Equity products comprised approximately 68% of institutional index AUM, ending the year at $911.8 billion, driven by net inflows of $44.6 billion and $110.4 billion of market appreciation. Net inflows in global, U.S. equity and other regional strategies were partially offset by outflows of $2.7 billion in other low fee currency overlays for equity strategies. Toward the end of the year, investors began to reallocate to higher return asset classes, helping to fuel a recovery in the global equity markets. Institutional index equity portfolios closely tracked their respective benchmarks, with 97%, 96% and 98% of AUM at or above tracking error tolerance for one-, three-, and five-year periods.
- Fixed income products represented approximately 32% or $425.9 billion of institutional index AUM, an increase of 19% or $68.4 billion. Net new business totaled $39.1 billion fueled by $12.8 billion of net inflows primarily in liability hedging strategies. Investors remained risk averse largely due to the European sovereign debt crisis in the first half of the year, favoring low risk fixed income exposures. As global markets stabilized and a recovery in the U.S. looked increasingly likely, equity markets recovered and investor confidence returned. Institutional index fixed income portfolios closely tracked their respective benchmarks, with 92%, 94% and 98% of AUM at or above tracking error tolerance for one-, three-, and five-year periods.
- Less than 1% of institutional index AUM is in alternatives or multi-asset class products. (See discussions under the "Asset Classes" section.)
iShares / ETPs
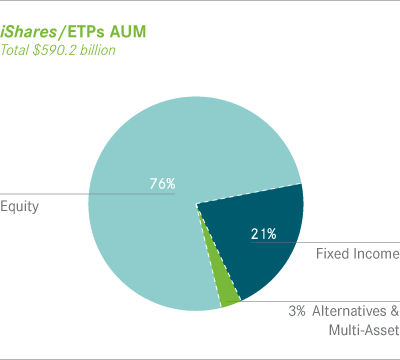 iShares is the leading exchange traded funds ("ETF") provider in the world, with $590.2 billion of AUM at December 31, 2010, an increase of $96.0 billion or 19% since year-end 2009. We were the top asset gatherer globally in 2010,3 with $44.0 billion of net inflows complemented by $52.0 billion of market appreciation. We also introduced 78 new ETPs during the year, maintaining our dual commitment to innovation and responsible product structuring. Our broad product range offers investors the building blocks required to assemble diversified portfolios and implement tactical asset allocation strategies and the liquidity required to make adjustments to their exposures quickly and cost-efficiently.
The market for ETPs continues to grow globally, with investor preference driven to varying degrees by performance (as measured by tracking error, which is the difference between net returns on the ETP and the corresponding index), liquidity (bid-ask spread), tax-efficiency, transparency and client service. Flows also reflect investor risk appetite, which shifted toward fixed income and, within equities, to broad and single country emerging market funds in 2010. In early 2011, investors have begun to shift equity allocations back to developed markets.
At year-end, our iShares product mix included $448.2 billion, or 76%, in equity offerings, and $123.1 billion, or 21%, in bond ETPs. The remaining $19.0 billion or 3% of iShares AUM was in multi-asset and alternative investments. iShares equity AUM increased $66.8 billion or 18% versus 2009, with $21.9 billion in net inflows and $44.9 billion of market and foreign exchange appreciation. iShares fixed income AUM rose $20.6 billion or 20% over the previous year, with 92% of the increase being driven by $19.0 billion of net inflows. iShares multi-asset and alternatives AUM grew by $8.6 billion or 84%, with $3.2 billion of net inflows, predominately in commodity products such as gold and silver, and $5.5 billion of market and foreign exchange appreciation.
At year end, our iShares offerings were traded on 19 exchanges throughout the world.
In total, we had net inflows in 315 different ETPs during 2010. As of year-end, we managed three of the top five, six of the top ten, and twelve of the 20 largest ETFs in the U.S.3 Our iShares offerings were traded on 19 exchanges throughout the world. These included 276 funds3 in the Americas with $480.3 billion, or 81%, of iShares AUM. Assets in these funds increased $77.6 billion, or 19%, during the year, including $27.8 billion of net inflows.
Notwithstanding a substantial increase in the number of ETP sponsors and products, iShares has maintained market share of more than 48% in the U.S. and 36% in EMEA3. In addition, we are the largest ETF manager in Mexico, have pioneered the product in Chile and Peru, and have introduced products in Brazil, Australia, Hong Kong and Japan. Importantly, our share of revenues is significantly higher due to our product mix. In general, we expect to maintain our pricing, so long as it is supported by performance and the iShares value proposition, although we continually seek to achieve efficiencies and pass them through to our clients.
3 Source, Year-end 2010 ETF Landscape Industry Review; BlackRock Global ETF Research and Implementation Strategy Team, Bloomberg, National Stock Exchange (NSX)
* Important Notes
On December 1, 2009, BlackRock acquired from Barclays Bank PLC all of the outstanding equity interests of subsidiaries of Barclays conducting the business of Barclays Global Investors ("BGI") ("the BGI Transaction").
Unless stated otherwise, net new business figures are before giving effect to merger related outflows resulting from manager concentration considerations and scientific active equity performance totaling $121.0 billion, or 7%, of the $1.8 trillion of AUM acquired in the BGI Transaction — well within overall tolerances in BlackRock's valuation model.
Past performance is not indicative of future results. The performance information for actively managed accounts reflects U.S. open-end and closed-end mutual funds and similar EMEA-based products with respect to peer median comparisons, and actively managed institutional and high net worth separate accounts and funds located globally with respect to benchmark comparisons, as determined using objectively based internal parameters, using the most current verified information available as of December 31, 2010. Accounts terminated prior to December 31, 2010 are not included. If such terminated and other accounts had been included, the performance information may have substantially differed from that shown. The performance information does not include funds or accounts that are not measured against a benchmark, private equity products, CDOs, or accounts managed by BlackRock's Financial Markets Advisory Group. Comparisons are based on gross-of-fee performance for U.S. retail, institutional and high net worth separate accounts and EMEA institutional separate accounts and net of fee performance for EMEA based retail products. The performance tracking information for institutional index accounts is based on gross-of-fee performance as of December 31, 2010, and includes all institutional accounts globally using an index strategy. AUM information is based on AUM for each account or fund in the asset class shown without adjustment for overlapping management of the same account or fund, as of December 31, 2010. Source of performance information and peer medians is BlackRock, Inc. and is based in part on data from Lipper Inc. for U.S. funds and Morningstar, Inc. for non-U.S. funds. Fund performance reflects the reinvestment of dividends and distributions, but does not reflect sales charges.
S&P 500® Index is a widely recognized, unmanaged index of common stock prices of industrial, utility, transportation and financial companies in U.S. markets.
Barclays Capital U.S. Aggregate Index is an unmanaged index considered representative of the U.S. investment-grade, fixed-rate bond market.
These opinions, expressed through page 40 of the 2010 BlackRock Annual Report, are those of BlackRock, Inc. as of April 2011 and are subject to change.
This is an interactive electronic version of the BlackRock 2010 Annual Report to Shareholders. The contents of this version are qualified in their entirety by reference to the printed version. A reproduction of the printed version is available in PDF in the "Investor Relations" section on this Web site.