Financial Highlights
(As of Dec. 31, 2007)
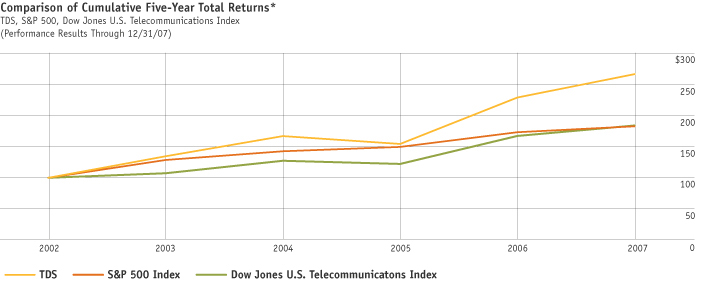
* Cumulative total return assumes reinvestment of dividends. Assumes $100.00 invested at the close of trading on the last trading day in 2002 in TDS Common Shares,
S&P 500 Index, and the Dow Jones U.S. Telecommunications Index. The period prior to May 13, 2005, is represented by the TDS Common Shares, and the period on
or after May 13, 2005, includes both the TDS Common Shares and the TDS Special Common Shares. The above represents selected information from the Stock Performance Graph included in the 2007 Annual Report.
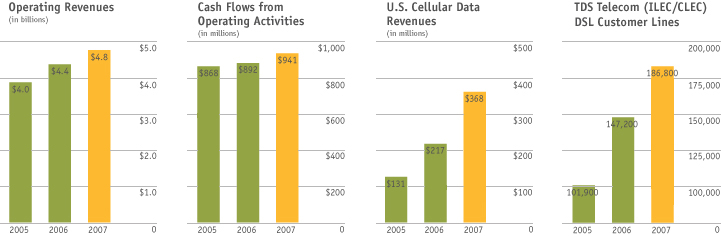
TDS Enterprise
- Provides wireless, wireline, and broadband services to 7.3 million customers in 36 states
- Operating revenues up 11 percent to $4.8 billion
- Operating income up 28 percent to $528 million
- Cash flows from operating activities up
5 percent to $941 million
- Repurchased 2,076,979 TDS special common shares
- Dividends paid for 33 consecutive years
|
|
U.S. Cellular
- Nation’s sixth-largest full-service wireless provider, with 6.1 million customers in 26 states
- Services revenues up 14 percent to $3.7 billion
- Data revenues up 69 percent to $368 million
- ARPU (average revenue per unit) up 8 percent to $51.13
- Operating cash flows up 23 percent to $863 million
- Low 1.4 percent retail postpay customer churn
|
|
TDS Telecom
(ILEC and CLEC)
- Operating income up 10 percent to $141 million
- 37 percent increase in ILEC DSL (digital subscriber line) accounts; 27 percent increase in total DSL accounts (ILEC and CLEC)
- DSL revenue up 32 percent to $81 million
- ILEC equivalent access lines up slightly to 762,700; 1,197,700 total equivalent access lines (ILEC and CLEC)
- 3.8 percent decrease in total operating expenses (ILEC and CLEC)
|
|