|
|
|
|
Telephone and Data Systems, Inc. and Subsidiaries -
Management's Discussion and Analysis of Financial Condition and Results of Operations
Telephone
and Data Systems, Inc. ("TDS") is a diversified telecommunications
company providing high-quality telecommunications services in
36 states to approximately 6.1 million wireless customers and
1.2 million wireline equivalent access lines at December 31,
2007. TDS conducts substantially all of its wireless operations through
its 80.8%-owned subsidiary, United States Cellular Corporation
("U.S. Cellular"), and its Incumbent Local Exchange Carrier and
Competitive Local Exchange Carrier wireline operations through its
wholly owned subsidiary, TDS Telecommunications Corporation
("TDS Telecom"). TDS conducts printing and distribution services
through its 80%-owned subsidiary, Suttle Straus, which represents a
small portion of TDS' operations.
The
following discussion and analysis should be read in conjunction with
TDS' audited consolidated financial statements and footnotes included
herein and the description of TDS' business included in Item 1 of
the TDS Annual Report on Form 10-K for the year ended
December 31, 2007.
The following is a summary of certain selected information from the
complete management discussion that follows the overview and does not
contain all of the information that may be important. You should
carefully read this entire Management's Discussion and Analysis of
Financial Condition and Results of Operations and not rely solely on
the overview.
U.S. Cellular — U.S. Cellular
offers wireless telecommunications services to approximately
6.1 million customers in five market areas in 26 states. As
of December 31, 2007, U.S. Cellular owned or had rights to
acquire interests in 260 wireless markets, operated approximately 6,400
cell sites, had over 400 U.S. Cellular operated retail stores and
had relationships with agents, dealers and non-Company retailers that
aggregated over 1,300 locations. U.S. Cellular employs a
customer satisfaction strategy which it believes has contributed to its
overall success, including a relatively low churn rate.
U.S. Cellular's business development strategy is to operate
controlling interests in wireless licenses in areas adjacent to or in
proximity to its other wireless licenses, thereby building contiguous
operating market areas. U.S. Cellular anticipates that operating
in contiguous market areas will continue to provide it with certain
economies in its capital and operating costs.
Financial
and operating highlights in 2007 included the following:
- Total
customers increased 5% year-over-year to 6.1 million; net retail
customer additions were up 12% from the prior year to 333,000.
- The
retail postpay churn rate per month was 1.4% compared to 1.6% for 2006.
Retail postpay customers comprised approximately 86% of
U.S. Cellular's total customer base as of December 31, 2007.
- Average
monthly service revenue per customer increased 8% year-over-year to $51.13.
- Additions
to property, plant and equipment totaled $565.5 million, including
expenditures to construct cell sites, increase capacity in existing
cell sites and switches, outfit new and remodel existing retail stores
and continue the development and enhancements of U.S. Cellular's
office systems. Total cell sites in service increased 8% year-over-year
to 6,383.
- To
strengthen its operating footprint, U.S. Cellular entered into an
exchange agreement with Sprint Nextel on November 30, 2007. The
exchange agreement calls for U.S. Cellular to receive personal
communication service ("PCS") spectrum in eight licenses covering
portions of four states (Oklahoma, West Virginia, Maryland and Iowa)
and, in exchange, to deliver PCS spectrum in eight licenses covering
portions of Illinois. The exchange of licenses will provide
U.S. Cellular with additional spectrum to meet anticipated future
capacity and coverage requirements in several of its key markets. No
other assets or liabilities were included in the exchange. In addition,
on February 1, 2007, U.S. Cellular purchased 100% of the
membership interests of Iowa 15 Wireless, LLC
("Iowa 15") and obtained the 25 megahertz Federal
Communications Commission ("FCC")
cellular license to provide wireless service in Iowa Rural Service Area
("RSA") 15 for approximately $18.3 million in cash.
- U.S. Cellular
expended $87.9 million in cash to repurchase its Common Shares in
2007. The repurchases were completed through private transactions with
an investment banking firm pursuant to accelerated share repurchase
agreements ("ASRs"). U.S. Cellular received $4.6 million in
January 2008 upon final settlement of the ASRs. As an offset to these
repurchases, U.S. Cellular received cash proceeds of
$10.1 million from re-issuance of treasury shares in connection
with employee benefits plans in 2007.
Service
Revenues increased 14%, to $3,679.2 million in 2007 from
$3,214.4 million in 2006. Customer growth and improvements in
average monthly revenue per unit have driven increased revenues.
U.S. Cellular continues to experience growth in its customer base,
driven by continued strong results in the postpay segment. In addition,
U.S. Cellular continues to experience increases in average monthly
revenue per unit driven by continuing migration of customers to
national, wide area and family service plans and growth in revenues
from our data products and services.
As
penetration in the industry increases over the next few years, future
customer growth may slow. U.S. Cellular believes that growth in
customers and revenues will be achieved primarily by capturing
customers switching from other wireless carriers, marketing additional
services to existing customers or increasing the number of multi-device
users rather than by adding new to the industry users.
Operating
Income increased $106.3 million, or 37%, to $396.2 million in
2007 from $289.9 million in 2006. The increase in Operating Income
reflected both higher operating revenues and a higher operating income
margin (as a percent of service revenues), which was 10.8% in 2007
compared to 9.0% in 2006.
Operating
income margin improved to 10.8% in 2007 from 9.0% in 2006.
U.S. Cellular anticipates that there will be continued pressure on
its operating income and operating income margin in the next few years
related to the following factors:
- costs
of customer acquisition and retention;
- effects
of competition;
- providing
service in recently launched or potential new market areas;
- potential
increases in prepaid and reseller customers as a percentage of U.S. Cellular's customer base;
- costs
of developing and introducing new products and services;
- continued
enhancements to its wireless networks, including potential deployments of new technology;
- increasing
costs of regulatory compliance; and
- uncertainty
in future eligible telecommunications carrier ("ETC") funding.
See
"Results of Operations–Wireless Operations."
TDS Telecom — TDS Telecom
provides high-quality telecommunication services, including
full-service local exchange service, long distance telephone service,
and Internet access, to rural and suburban area communities.
TDS Telecom's business plan is designed for a full-service
telecommunications company, including competitive local exchange
carrier operations ("CLEC"), by leveraging TDS Telecom's strength
as an incumbent local exchange carrier ("ILEC"). TDS Telecom's
strategy is to be the preferred provider of telecommunications
services–including voice, broadband, and video services–in its chosen
markets. This strategy encompasses many components including:
developing service and product, market and customer strategies;
investing in networks and deploying advanced technologies; monitoring
the competitive environment; advocating with respect to state and
federal regulation for positions that support
its ability to provide advanced telecommunications services to its
customers; and exploring transactions to acquire or divest properties
that would result in strengthening its operations.
Both
ILECs and CLECs are faced with significant challenges, including the
industry decline in use of second lines by customers, growing
competition from wireless and other wireline providers (other CLECs and
cable providers), changes in regulation, new technologies such as Voice
over Internet Protocol ("VoIP"), and the uncertainty in the economy.
These challenges could have a material adverse effect on the financial
condition, results of operations and cash flows of TDS Telecom in
the future.
Overall
equivalent access lines served by TDS Telecom decreased 1% in
2007. ILEC equivalent access lines increased 1% in 2007, while CLEC
equivalent access lines decreased 5% in 2007. The number of equivalent
access lines served by TDS Telecom's ILEC and CLEC were 762,700
and 435,000, respectively, at December 31, 2007.
Operating
revenues decreased 2% to $860.2 million in 2007 from
$875.9 million in 2006. The decrease in 2007 was primarily due to
lower ILEC access revenues due to a decline in network access minutes
of use and lower compensation from state and national revenue pools.
Operating
income increased 10% to $141.2 million in 2007 compared to
$128.9 million in 2006 primarily as a result of decreased
operating expenses. Operating margins improved in 2007 to 16.4% from
14.7% in 2006. The increase in 2007 was primarily due to the improved
operating results of the CLEC operations.
See
"Results of Operations–Wireline Operations."
Cash Flows and Investments - TDS
and its subsidiaries had cash and cash equivalents totaling
$1,174.4 million, availability under their revolving credit
facilities of $1,296.3 million, and additional bank lines of
credit of $25 million as of December 31, 2007. TDS and its
subsidiaries are also generating substantial internal funds from
operations. Cash flow from operating activities totaled
$941.0 million in 2007, $892.2 million in 2006 and
$868.2 million in 2005. Management believes that cash on hand,
expected future cash flows from operating activities and sources of
external financing provide substantial financial flexibility and are
sufficient to permit TDS and its subsidiaries to finance their
contractual obligations and anticipated capital expenditures for the
foreseeable future.
See
"Financial Resources" and "Liquidity and Capital Resources"–for additional information related to cash flows and investments.
Year Ended December 31,
|
|
2007 |
|
Increase/
(Decrease) |
|
Percentage
Change |
|
2006 |
|
Increase/
(Decrease) |
|
Percentage
Change |
|
2005 |
|
| (Dollars in thousands) |
|
|
|
| Operating revenues |
|
|
|
|
|
|
|
|
|
|
|
|
|
|
|
|
|
|
|
|
| |
U.S. Cellular |
|
$ |
3,946,264 |
|
$ |
473,109 |
|
13.6 |
% |
$ |
3,473,155 |
|
$ |
442,390 |
|
14.6 |
% |
$ |
3,030,765 |
|
| |
Telecom |
|
|
860,211 |
|
|
(15,707 |
) |
(1.8 |
)% |
|
875,918 |
|
|
(28,167 |
) |
(3.1 |
)% |
|
904,085 |
|
| |
All other(1) |
|
|
22,509 |
|
|
7,064 |
|
45.7 |
% |
|
15,445 |
|
|
(2,683 |
) |
(14.8 |
)% |
|
18,128 |
|
| |
|
Total operating revenues |
|
|
4,828,984 |
|
|
464,466 |
|
10.6 |
% |
|
4,364,518 |
|
|
411,540 |
|
10.4 |
% |
|
3,952,978 |
|
Operating expenses |
|
|
|
|
|
|
|
|
|
|
|
|
|
|
|
|
|
|
|
|
| |
U.S. Cellular |
|
|
3,550,065 |
|
|
366,806 |
|
11.5 |
% |
|
3,183,259 |
|
|
383,691 |
|
13.7 |
% |
|
2,799,568 |
|
| |
Telecom |
|
|
719,009 |
|
|
(28,053 |
) |
(3.8 |
)% |
|
747,062 |
|
|
3,702 |
|
0.5 |
% |
|
743,360 |
|
| |
All other(1) |
|
|
32,012 |
|
|
10,592 |
|
49.4 |
% |
|
21,420 |
|
|
(7,932 |
) |
(27.0 |
)% |
|
29,352 |
|
| |
|
Total operating expenses |
|
|
4,301,086 |
|
|
349,345 |
|
8.8 |
% |
|
3,951,741 |
|
|
379,461 |
|
10.6 |
% |
|
3,572,280 |
|
Operating income (loss) |
|
|
|
|
|
|
|
|
|
|
|
|
|
|
|
|
|
|
|
|
| |
U.S. Cellular |
|
|
396,199 |
|
|
106,303 |
|
36.7 |
% |
|
289,896 |
|
|
58,699 |
|
25.4 |
% |
|
231,197 |
|
| |
Telecom |
|
|
141,202 |
|
|
12,346 |
|
9.6 |
% |
|
128,856 |
|
|
(31,869 |
) |
(19.8 |
)% |
|
160,725 |
|
| |
All other(1) |
|
|
(9,503 |
) |
|
(3,528 |
) |
(59.0 |
)% |
|
(5,975 |
) |
|
5,249 |
|
46.8 |
% |
|
(11,224 |
) |
| |
|
Total operating income (loss) |
|
|
527,898 |
|
|
115,121 |
|
27.9 |
% |
|
412,777 |
|
|
32,079 |
|
8.4 |
% |
|
380,698 |
|
Other income and (expenses) |
|
|
|
|
|
|
|
|
|
|
|
|
|
|
|
|
|
|
|
|
| |
Equity in earnings of unconsolidated entities |
|
|
91,831 |
|
|
(3,339 |
) |
(3.5 |
)% |
|
95,170 |
|
|
27,131 |
|
39.9 |
% |
|
68,039 |
|
| |
Interest and dividend income |
|
|
199,435 |
|
|
4,791 |
|
2.5 |
% |
|
194,644 |
|
|
38,162 |
|
24.4 |
% |
|
156,482 |
|
| |
Fair value adjustment of derivative instruments |
|
|
(351,570 |
) |
|
(52,045 |
) |
(17.4 |
)% |
|
(299,525 |
) |
|
(1,033,253 |
) |
N/M |
|
|
733,728 |
|
| |
Gain (loss) on investments |
|
|
432,993 |
|
|
271,147 |
|
167.5 |
% |
|
161,846 |
|
|
168,100 |
|
N/M |
|
|
(6,254 |
) |
| |
Interest expense |
|
|
(208,736 |
) |
|
25,807 |
|
11.0 |
% |
|
(234,543 |
) |
|
(18,522 |
) |
(8.6 |
)% |
|
(216,021 |
) |
| |
Other income (expense) |
|
|
(6,401 |
) |
|
630 |
|
9.0 |
% |
|
(7,031 |
) |
|
2,506 |
|
26.3 |
% |
|
(9,537 |
) |
| |
Income tax expense(2) |
|
|
(269,054 |
) |
|
(152,595 |
) |
(131.0 |
)% |
|
(116,459 |
) |
|
306,726 |
|
72.5 |
% |
|
(423,185 |
) |
| |
Minority share of income |
|
|
(73,111 |
) |
|
(27,991 |
) |
(62.0 |
)% |
|
(45,120 |
) |
|
(7,913 |
) |
(21.3 |
)% |
|
(37,207 |
) |
| |
Discontinued operations |
|
|
– |
|
|
– |
|
– |
|
|
– |
|
|
(997 |
) |
N/M |
|
|
997 |
|
| |
Extraordinary item |
|
|
42,827 |
|
|
42,827 |
|
N/M |
|
|
– |
|
|
– |
|
– |
|
|
– |
|
| |
Preferred dividend requirement |
|
|
(52 |
) |
|
113 |
|
68.5 |
% |
|
(165 |
) |
|
37 |
|
N/M |
|
|
(202 |
) |
Net Income available to common |
|
$ |
386,060 |
|
$ |
224,466 |
|
138.9 |
% |
$ |
161,594 |
|
$ |
(485,944 |
) |
(75.0 |
)% |
$ |
647,538 |
|
Basic Earnings Per Share |
|
$ |
3.28 |
|
$ |
1.89 |
|
136.0 |
% |
$ |
1.39 |
|
$ |
(4.23 |
) |
(75.3 |
)% |
$ |
5.62 |
|
| Diluted Earnings Per Share |
|
$ |
3.22 |
|
$ |
1.85 |
|
135.0 |
% |
$ |
1.37 |
|
$ |
(4.20 |
) |
(75.4 |
)% |
$ |
5.57 |
|
Operating Revenues
In
2007, operating revenues increased 10.6% primarily reflecting growth in
wireless customers and average monthly service revenue per wireless
customer. U.S. Cellular revenue growth reflects wireless customer
growth of 5% in 2007 and 6% in 2006; and growth in average monthly
service revenue per wireless customer of 7% in 2007 and 4% in 2006.
TDS Telecom operating revenues decreased primarily reflecting
lower ILEC access revenues due to a decline in network access minutes
of use and lower compensation from state and national revenue pools.
Equivalent access lines decreased 1% in 2007 and increased 3% in 2006.
Operating Expenses
In
2007, the increase primarily reflects costs associated with acquiring
customers and serving and retaining its expanding customer base at
U.S. Cellular. In 2006, the increase is due primarily to the costs
associated with providing service to an expanding customer base,
additional depreciation expense and costs associated with launching new
markets and acquisitions at U.S. Cellular.
Operating Income
The
increase in operating income in 2007 and 2006 reflect higher operating
revenues at U.S. Cellular. The increase in 2007 at
TDS Telecom was primarily due to cost reduction initiatives
implemented in 2006 and 2007. The decrease in 2006 at TDS Telecom
was primarily due to the ILEC decrease in revenues generated from lower
network usage and lower average access rates coupled with higher costs
of providing services and products.
Equity in earnings of unconsolidated entities
Equity
in earnings of unconsolidated entities represents TDS' share of net
income from markets in which it has a minority interest and that are
accounted for by the equity method. TDS follows the equity method of
accounting for minority interests in which its ownership interest
equals or exceeds 20% for corporations and 3% for partnerships and
limited liability companies.
TDS'
investment in the Los Angeles SMSA Limited Partnership
("LA Partnership") contributed $71.2 million,
$62.3 million and $52.2 million in equity in earnings of
unconsolidated entities in 2007, 2006 and 2005, respectively. TDS also
received cash distributions from LA Partnership of
$66.0 million, $60.5 million and $38.5 million in 2007,
2006 and 2005, respectively.
Interest and dividend income
In
2007, TDS recorded dividend income of $128.5 million from its
investment in Deutsche Telekom and $2.1 million from its
investment in Vodafone. In 2006, TDS recorded dividend income of
$120.3 million from its investment in Deutsche Telekom and
$14.5 million from its investment in Vodafone. In 2005, TDS
recorded dividend income of $105.7 million from its investment in
Deutsche Telekom and $10.1 million from its investment in
Vodafone. The increase in interest and dividend income in 2007 is
primarily due to the increase in the dividend paid by Deutsche Telekom
($8.2 million) and higher average investment balances in 2007 than
2006. This was offset by reduced dividends from Vodafone
($12.4 million) reflecting the settlement of TDS' and
U.S. Cellular's variable prepaid forward contracts related to
these securities. The increase in interest and dividend income in 2006
is primarily due to increases in the dividends paid by Deutsche Telekom
($14.6 million) and Vodafone ($4.4 million), and higher
average rates of interest earned on investments in 2006 than 2005.
Interest income increased $20.6 million in 2006 primarily due to
higher interest rates.
Fair value adjustment of derivative instruments
Fair
value adjustments of derivative instruments reflect the change in the
fair value of the bifurcated embedded collars within the forward
contracts related to the Deutsche Telekom, Vodafone and VeriSign
marketable equity securities.
Gain (loss) on investments
The
gain in 2007 consists of a $426.7 million gain recorded on the
delivery of the Vodafone American Depository Receipts ("ADRs"),
VeriSign Common Shares and a portion of the Deutsche Telekom ordinary
shares to settle the related variable prepaid forward contracts and the
sale of the remaining Vodafone ADRs, VeriSign Common Shares and
Deutsche Telekom ordinary shares related to the settled forward
contracts. Also included in 2007 is a $6.3 million additional gain
from the sale of U.S. Cellular's interest in Midwest Wireless
Communications, LLC ("Midwest Wireless") that occurred in 2006.
The
gain in 2006 was primarily due to the $90.3 million gain at
TDS Telecom from its remittance of Rural Telephone Bank ("RTB")
shares. See Note 2–Gain (Loss) on Sale of Investments in the Notes
to the Consolidated Financial Statements. Also in 2006,
U.S. Cellular sold its interest in Midwest Wireless and recorded a
gain of $70.4 million. See Note 5–Acquisitions, Divestitures
and Exchanges in the Notes to the Consolidated Financial Statements for
more information on the disposition of Midwest Wireless.
In
2005, U.S. Cellular reduced the carrying value of one of its
equity method investments by $6.8 million to its underlying fair
value based on a cash flow analysis.
Interest expense
The
decrease in interest expense in the year ended December 31, 2007
was primarily due to a decrease in interest related to TDS' 7.0% senior
notes that were paid off in the third quarter of 2006
($8.2 million), a decrease in interest paid on variable prepaid
forward contracts related to the settlement of various prepaid forward
contracts ($13.9 million), and a decrease in interest related to
U.S. Cellular's revolving credit facility ($3.4 million).
The
increase in interest expense in 2006 was primarily due to an increase
in interest paid on variable prepaid forward contracts related to
interest rate increases ($24.1 million), the new debt issuance of
6.625% Senior Notes in March 2005 of $116.25 million
($1.9 million) and the increase in interest rates on revolving
credit facilities ($5.7 million). The increase in interest expense
was partially offset by the repayment of TDS' $200.0 million 7%
unsecured Senior Notes in August 2006 ($6.0 million), the
repayment of $35.0 million of medium-term notes
($3.1 million) in 2006 and the repayment of TDS Telecom's
subsidiary debt in March and June of 2005 ($5.2 million).
Other income (expense)
Borrowing
costs on the variable prepaid forward contracts increased
$0.3 million in 2007 compared to 2006. In addition, in 2005,
TDS Telecom recorded prepayment penalties and unamortized debt
issuance cost write-offs of $2.2 million on the repayment of
long-term debt and TDS incurred $2.9 million of expenses from the
Special Common Share proposal and stock dividend.
Income tax expense (benefit)
The
effective tax rate on Income from Continuing Operations Before Income
Taxes and Minority Interest was 39.3%, 36.0% and 38.2% for 2007, 2006
and 2005, respectively. These effective rates reflect 1.8%, 3.6% and
0.5% in 2007, 2006 and 2005, respectively related to foreign taxes,
primarily attributable to dividends received from Deutsche Telekom.
Income
from continuing operations in 2007, 2006, and 2005 includes gains and
losses (reported in the captions (Gain) loss on asset
disposals/exchanges, Fair value adjustment of derivative instruments
and Gain (loss) on investments in the Consolidated Statements of
Operations). The income tax expense or benefit recognized with respect
to such gains and losses was as follows:
2007
- Tax
expense of $147.1 million was recorded upon the delivery of
certain Deutsche Telekom ordinary shares, Vodafone ADRs, and VeriSign
common shares in settlement of variable prepaid forward contracts and
the disposition of certain remaining Deutsche Telekom ordinary shares,
all remaining Vodafone ADRs, and all remaining VeriSign common shares.
- Tax
benefit of $129.0 million was recorded on the fair value adjustment of derivative instruments.
- Tax
benefit of $7.7 million was recognized on the loss on exchange of
assets that was recorded in conjunction with the Sprint Nextel spectrum
exchange transaction.
- Tax
expense of $2.5 million was recorded on the sale of interest in
Midwest Wireless that occurred in the fourth quarter of 2006.
2006
- Tax
expense of $30.9 million was recorded on the gain from the sale of Midwest Wireless.
- Tax
expense of $32.4 million was recorded on the sale of RTB stock.
- Tax
benefit of $115.6 million was recorded on the fair value adjustment of derivative instruments.
2005
- Tax
expense of $17.4 million was recorded on the gain from the exchange of assets with ALLTEL.
- Tax
benefit of $2.6 million was recorded on the loss on impairment of an unconsolidated investment.
- Tax
expense of $289.6 million was recorded on the fair value adjustment of derivative instruments.
Such
gains and losses increased/(decreased) the effective tax rate by (1.7%), (0.5%) and 3.1% in 2007, 2006 and 2005, respectively.
Minority share of income
Minority
share of income includes the minority public shareholders' share of
U.S. Cellular's net income, the minority shareholders' or
partners' share of certain U.S. Cellular subsidiaries' net income
or loss and other TDS minority interests.
Year Ended December 31,
|
|
2007 |
|
2006 |
|
2005 |
|
| (Dollars in thousands) |
|
|
|
| Minority share of income |
|
|
|
|
|
|
|
|
|
|
| |
U.S. Cellular |
|
|
|
|
|
|
|
|
|
|
| |
|
Minority public shareholders' interest |
|
$ |
(60,600 |
) |
$ |
(33,996 |
) |
$ |
(28,703 |
) |
| |
|
Subsidiaries' minority interests |
|
|
(12,398 |
) |
|
(10,891 |
) |
|
(8,366 |
) |
| |
|
|
(72,998 |
) |
|
(44,887 |
) |
|
(37,069 |
) |
| Other Subsidiaries |
|
|
(113 |
) |
|
(233 |
) |
|
(138 |
) |
| |
|
$ |
(73,111 |
) |
$ |
(45,120 |
) |
$ |
(37,207 |
) |
Discontinued operations
TDS
is party to an indemnity agreement with T-Mobile USA, Inc.
regarding certain contingent liabilities for Aerial
Communications, Inc. ("Aerial"), a former subsidiary of TDS. TDS
has recorded in 2000 an accrual for expenses, primarily tax related,
resulting from Aerial's merger into VoiceStream Wireless Corporation
("VoiceStream").
In
2005, TDS also recorded a gain of $1.0 million ($1.5 million,
net of a $0.5 million income tax expense), or $0.01 per diluted
share, for discontinued operations relating to a reduction in this
indemnity accrual due to the favorable outcome of a state tax audit
which reduced the potential indemnity obligation.
Extraordinary item
Historically,
TDS Telecom's ILEC operations followed the accounting for
regulated enterprises prescribed by Financial Accounting Standards
Board ("FASB") Statement of Financial Accounting Standards ("SFAS")
No. 71, Accounting for the Effects of Certain Types of Regulation,
("SFAS 71"). This accounting recognizes the economic effects of
rate-making actions of regulatory bodies in the financial statements of
the TDS Telecom ILEC operations.
TDS Telecom
has regularly monitored the appropriateness of the application of
SFAS 71. Recent changes in TDS Telecom's business environment
have caused competitive forces to surpass regulatory forces such that
TDS Telecom has concluded that it is no longer reasonable to
assume that rates set at levels that will recover the enterprise's cost
can be charged to its customers.
TDS Telecom
has experienced increasing access line losses due to increasing levels
of competition across all of the ILEC service areas. Competition has
intensified in 2007 from cable and wireless operators who have extended
their investment beyond major markets to enable a broader range of
voice and data services that compete directly with TDS Telecom's
service offerings. These alternative telecommunications providers have
transformed a pricing structure historically based on the recovery of
costs to a pricing structure based on market conditions. Consequently,
TDS Telecom has had to alter its strategy to compete in its
markets. Specifically, in the third quarter of 2007, TDS Telecom
initiated an aggressive program of service bundling and deep
discounting and has made the decision to voluntarily exit certain
revenue pools administered by the FCC-supervised National Exchange
Carrier Association in order to achieve additional pricing flexibility
to meet competitive pressures.
Based
on these material factors impacting its operations, management
determined in the third quarter of 2007 that it is no longer
appropriate to continue the application of SFAS 71 for reporting
its financial results. Accordingly, TDS Telecom recorded a
non-cash extraordinary gain of $42.8 million, net of taxes of
$27.0 million, upon discontinuance of the provisions of
SFAS 71, as required by the provisions of SFAS No. 101, Regulated Enterprises–Accounting for the
Discontinuation of the Application of FASB Statement No. 71.
Net income available to common
Net
income available to common increased in 2007 primarily due to an
increase in Operating income and an increase in Gain/(loss) on
investments primarily attributable to the settlement of variable
prepaid forward contracts. In 2006 the decrease is primarily
attributable to the loss in the fair value of derivative instruments.
Results of Operations–Wireless Operations TDS provides wireless service through U.S. Cellular, an 80.8%-owned
subsidiary. U.S. Cellular owns, manages and invests in wireless
markets throughout the United States. Growth in the customer base is
the primary reason for the change in U.S. Cellular's results of
operations in 2007 and 2006. The number of customers increased 5% to
6,122,000 at December 31, 2007, and increased 6% to 5,815,000 at
December 31, 2006, from 5,482,000 at December 31, 2005. In
2007, U.S. Cellular added 301,000 net new customers from its
marketing distribution channels and acquired 6,000 customers in
one transaction. In 2006, U.S. Cellular added 310,000 net new
customers from its marketing distribution channels and acquired a net
total of 23,000 customers in three transactions. See "Liquidity and
Capital Resources–Acquisitions, Divestitures and Exchanges" for a
discussion of these transactions.
Following
are tables of summarized operating data for U.S. Cellular's
consolidated operations. There have been changes in the way that
U.S. Cellular calculates certain information in the table below.
See footnotes (2), (7) and (8) to table below, for further
discussion):
As of December 31,(1)
|
|
2007 |
|
2006 |
|
2005 |
|
| Total market population of consolidated operating markets(2) |
|
|
44,955,000 |
|
|
44,043,000 |
|
|
43,362,000 |
|
| Customers(3) |
|
|
6,122,000 |
|
|
5,815,000 |
|
|
5,482,000 |
|
| Market penetration(2) |
|
|
13.6 |
% |
|
13.2 |
% |
|
12.6 |
% |
| Total full-time equivalent employees |
|
|
7,837 |
|
|
7,608 |
|
|
7,300 |
|
| Cell sites in service |
|
|
6,383 |
|
|
5,925 |
|
|
5,428 |
|
For the Year Ended December 31,(4)
|
|
2007 |
|
2006 |
|
2005 |
|
| Net customer additions(5) |
|
|
301,000 |
|
|
310,000 |
|
|
477,000 |
|
| Net retail customer additions(5) |
|
|
333,000 |
|
|
297,000 |
|
|
411,000 |
|
| Average monthly service revenue per customer(6) |
|
$ |
51.13 |
|
$ |
47.23 |
|
$ |
45.24 |
|
| Retail postpay churn rate per month(7) |
|
|
1.4 |
% |
|
1.6 |
% |
|
1.6 |
% |
| Total postpay churn rate per month(7) |
|
|
1.7 |
% |
|
2.1 |
% |
|
2.1 |
% |
| Sales and marketing cost per gross customer addition(8) |
|
$ |
487 |
|
$ |
385 |
|
$ |
372 |
|
As of December 31,
|
|
2007 |
|
2006 |
|
2005 |
| Customers on postpay service plans in which the end user is a customer of U.S. Cellular ("postpay customers") |
|
5,269,000 |
|
4,912,000 |
|
4,633,000 |
| End user customers acquired through U.S. Cellular's agreement with a third party ("reseller customers")* |
|
558,000 |
|
590,000 |
|
555,000 |
| Total postpay customers |
|
5,827,000 |
|
5,502,000 |
|
5,188,000 |
| Customers on prepaid service plans in which the end user is a customer of U.S. Cellular ("prepaid customers") |
|
295,000 |
|
313,000 |
|
294,000 |
| Total customers |
|
6,122,000 |
|
5,815,000 |
|
5,482,000 |
Year Ended December 31,
|
|
2007 |
|
2006 |
|
2005 |
| Service Revenues per Consolidated Statements of Operations (000s) |
|
$ |
3,679,237 |
|
$ |
3,214,410 |
|
$ |
2,827,022 |
| Divided by average customers during period (000s)* |
|
|
5,997 |
|
|
5,671 |
|
|
5,207 |
| Divided by number of months in each period |
|
|
12 |
|
|
12 |
|
|
12 |
| Average monthly service revenue per customer |
|
$ |
51.13 |
|
$ |
47.23 |
|
$ |
45.24 |
Components of Operating Income
Year Ended December 31,
|
|
2007 |
|
Increase/
(Decrease) |
|
Percentage
Change |
|
2006 |
|
Increase/
(Decrease) |
|
Percentage
Change |
|
2005 |
|
| (Dollars in thousands) |
|
|
|
| Retail service |
|
$ |
3,186,167 |
|
$ |
365,864 |
|
13.0 |
% |
$ |
2,820,303 |
|
$ |
335,732 |
|
13.5 |
% |
$ |
2,484,571 |
|
| Inbound roaming |
|
|
206,553 |
|
|
48,304 |
|
30.5 |
% |
|
158,249 |
|
|
13,223 |
|
9.1 |
% |
|
145,026 |
|
| Long-distance and other |
|
|
286,517 |
|
|
50,659 |
|
21.5 |
% |
|
235,858 |
|
|
38,433 |
|
19.5 |
% |
|
197,425 |
|
| |
Service revenues |
|
|
3,679,237 |
|
|
464,827 |
|
14.5 |
% |
|
3,214,410 |
|
|
387,388 |
|
13.7 |
% |
|
2,827,022 |
|
| Equipment sales |
|
|
267,027 |
|
|
8,282 |
|
3.2 |
% |
|
258,745 |
|
|
55,002 |
|
27.0 |
% |
|
203,743 |
|
| |
Total Operating Revenues |
|
|
3,946,264 |
|
|
473,109 |
|
13.6 |
% |
|
3,473,155 |
|
|
442,390 |
|
14.6 |
% |
|
3,030,765 |
|
System operations (excluding depreciation, amortization and accretion shown below) |
|
|
717,075 |
|
|
77,392 |
|
12.1 |
% |
|
639,683 |
|
|
35,590 |
|
5.9 |
% |
|
604,093 |
|
| Cost of equipment sold |
|
|
640,225 |
|
|
71,322 |
|
12.5 |
% |
|
568,903 |
|
|
56,964 |
|
11.1 |
% |
|
511,939 |
|
| Selling, general and administrative |
|
|
1,555,639 |
|
|
156,078 |
|
11.2 |
% |
|
1,399,561 |
|
|
181,852 |
|
14.9 |
% |
|
1,217,709 |
|
| Depreciation, amortization and accretion |
|
|
582,269 |
|
|
26,744 |
|
4.8 |
% |
|
555,525 |
|
|
65,432 |
|
13.4 |
% |
|
490,093 |
|
| Gain (loss) on asset disposals/exchanges |
|
|
54,857 |
|
|
35,270 |
|
N/M |
|
|
19,587 |
|
|
43,853 |
|
N/M |
|
|
(24,266 |
) |
| |
Total Operating Expenses |
|
|
3,550,065 |
|
|
366,806 |
|
11.5 |
% |
|
3,183,259 |
|
|
383,691 |
|
13.7 |
% |
|
2,799,568 |
|
| |
Total Operating Income |
|
$ |
396,199 |
|
$ |
106,303 |
|
36.7 |
% |
$ |
289,896 |
|
$ |
58,699 |
|
25.4 |
% |
$ |
231,197 |
|
Operating Income Margin (as a percent of service revenues) |
|
|
10.8% |
|
|
|
|
|
|
|
9.0% |
|
|
|
|
|
|
|
8.2% |
|
Operating Revenues
Service revenues
Service
revenues primarily consist of: (i) charges for access, airtime,
roaming, recovery of regulatory costs and value-added services,
including data products and services, provided to U.S. Cellular's
retail customers and to end users through third party resellers
("retail service"); (ii) charges to other wireless carriers whose
customers use U.S. Cellular's wireless systems when roaming
("inbound roaming"); (iii) charges for long-distance calls made on
U.S. Cellular's systems; and (iv) amounts received from the
Federal Universal Service Fund ("USF").
The
increases in service revenues were due to the growth in the customer
base, which increased to 6.1 million in 2007 from 5.8 million
in 2006 and from 5.5 million in 2005 and higher monthly service
revenue per customer; monthly service revenue per customer averaged
$51.13 in 2007, $47.23 in 2006 and $45.24 in 2005.
Retail service revenues
The
increase in retail service revenues each year was due primarily from
growth in U.S. Cellular's average customer base and an increase in
average monthly retail revenue per customer.
U.S. Cellular's
average customer base increased 6% to 5,997,000 in 2007 and 9% to
5,671,000 in 2006. The increase in the average number of customers each
year was primarily driven by the net new customer additions that
U.S. Cellular generated from its marketing (including reseller)
distribution channels (301,000 and 310,000 in 2007 and 2006,
respectively). The average number of customers also was affected by the
timing of acquisitions, divestitures and exchanges.
U.S. Cellular
anticipates that its customer base will increase during 2008 as a
result of its continuing focus on customer satisfaction, attractively
priced service plans, a broader line of handsets and other products,
improvements in distribution and growth in customers.
U.S. Cellular believes growth in its customer base will primarily
be from capturing people switching from other wireless carriers or
increasing the number of multi-device users rather than by adding new
to the industry users. However, the level of growth in the customer
base for 2008 will depend upon U.S. Cellular's ability to attract
new customers and retain existing customers in a highly, and
increasingly, competitive marketplace. See "Overview–2008 Estimates"
above for U.S. Cellular's estimate of net retail customer
additions for 2008.
The
increase in average monthly retail service revenue was driven primarily
by growth in revenues from data services and higher regulatory fees
such as universal service fund contributions that are billed to
customers. Average monthly retail service revenues per customer
increased 7% to $44.27 in 2007 from $41.44 in 2006, and increased 4% in
2006 from $39.76 in 2005.
Monthly
local retail minutes of use per customer averaged 859 in 2007, 704 in
2006 and 625 in 2005. The increases in both years were primarily driven
by U.S. Cellular's focus on designing sales incentive programs and
customer billing rate plans to stimulate overall usage. The impact on
retail service revenues of the increase in average monthly minutes of
use was offset by a decrease in average revenue per minute of use. The
decrease in average revenue per minute of use reflects the impact of
increasing competition, which has led to the inclusion of an increasing
number of minutes in package pricing plans and the inclusion of
features such as unlimited night and weekend minutes in certain pricing
plans. U.S. Cellular anticipates that its average revenue per
minute of use may continue to decline in the future, reflecting
increased competition and continued penetration of the consumer market.
Revenues
from data products and services grew significantly year-over-year,
totaling $367.6 million in 2007, $217.4 million in 2006 and
$131.3 million in 2005 and representing 10% of total service
revenues in 2007, compared to 7% and 5% of total service revenues in
2006 and 2005, respectively. Such growth, which positively impacted
average monthly retail service revenues per customer, reflected
customers' continued
increasing acceptance and usage of U.S. Cellular's easyedgeSM products and offerings, such as Short Messaging Service
("SMS") and BlackBerry® handsets and service.
Inbound roaming revenues
The
increase in inbound roaming revenues in both years was related
primarily to an increase in roaming minutes of use, partially offset by
a decrease in revenue per roaming minute of use. The increase in
inbound roaming minutes of use was driven primarily by the overall
growth in the number of customers and retail minutes of use per
customer throughout the wireless industry, including usage related to
data products, leading to an increase in inbound traffic from other
wireless carriers. The decline in revenue per minute of use is
primarily due to the general downward trend in negotiated rates, and
the changing mix of traffic from various carriers with different
negotiated rates.
U.S. Cellular
anticipates that inbound roaming minutes of use might continue to grow
over the next few years, reflecting continuing industry-wide growth in
customers and usage per customer, including increased usage of data
services while roaming, but that the rate of growth will decline due to
higher penetration, slower overall growth in the consumer wireless
market and the consolidation of wireless carriers. U.S. Cellular
anticipates that its roaming revenue per minute of use will remain
fairly constant over the next few years pursuant to its existing
contract rates, but that renewal of these contracts and the negotiation
of new contracts will reflect lower rates over time.
Long-distance and other revenues
In
2007, the increase compared to 2006 reflected an $18.8 million
increase in long-distance revenues and a $31.8 million increase in
other revenues. In 2006, the increase compared to 2005 reflected a
$10.2 million increase in long-distance revenues and a
$28.3 million increase in other revenues. The increase in
long-distance revenues in both years was driven by an increase in the
volume of long-distance calls billed both to U.S. Cellular's
customers and to other wireless carriers whose customers used
U.S. Cellular's systems to make long-distance calls. The growth in
other revenues in both years was due primarily to an increase in ETC
funds that were received from the USF. In 2007, 2006 and 2005,
U.S. Cellular was eligible to receive eligible telecommunication
carrier funds in nine, seven and five states, respectively.
Equipment sales revenues
Equipment
sales revenues include revenues from sales of handsets and related
accessories to both new and existing customers, as well as revenues
from sales of handsets to agents. All equipment sales revenues are
recorded net of anticipated rebates.
U.S. Cellular
continues to offer a competitive line of quality handsets to both new
and existing customers. U.S. Cellular's customer retention efforts
include offering new handsets at discounted prices to existing
customers as the expiration date of the customer's service contract
approaches. U.S. Cellular also continues to sell handsets to
agents; this practice enables U.S. Cellular to provide better
control over the quality of handsets sold to its customers, establish
roaming preferences and earn quantity discounts from handset
manufacturers which are passed along to agents. U.S. Cellular
anticipates that it will continue to sell handsets to agents in the
future.
The
increase in equipment sales revenues in 2007 and 2006 was driven by an
increase in the number of handsets sold. The number of handsets sold
increased 3% and 12% in 2007 and 2006, respectively. The increase in
2006 equipment sales revenues also was driven by an increase of 14% in
average revenue per handset sold, primarily reflecting a shift to the
sale of more expensive handsets with expanded capabilities. Average
revenue per handset sold was flat in 2007 compared to 2006.
Operating Expenses
System operations expenses (excluding depreciation, amortization and accretion)
System
operations expenses (excluding depreciation, amortization and
accretion) include charges from wireline telecommunications service
providers for U.S. Cellular's customers' use of their facilities,
costs related to local interconnection to the wireline network, charges
for maintenance of U.S. Cellular's network, long-distance charges,
outbound roaming expenses and payments to third-party data product and
platform developers. Key components of the overall increases in system
operations expenses were as follows:
- maintenance,
utility and cell site expenses increased $27.5 million, or 11%, in
2007 and $40.1 million, or 18%, in 2006, primarily driven by an
increase in the number of cell sites within U.S. Cellular's
network. The number of cell sites totaled 6,383 in 2007, 5,925 in 2006
and 5,428 in 2005, as U.S. Cellular continued to grow by expanding
and enhancing coverage in its existing markets and also through
acquisitions of existing wireless operations;
- the
cost of network usage on U.S. Cellular's systems increased
$20.3 million, or 8%, in 2007 and $18.7 million, or 8%, in
2006, as total minutes used on U.S. Cellular's systems increased
28% in 2007 and 26% in 2006 primarily driven by migration to pricing
plans with a larger number of packaged minutes, mostly offset by the
ongoing reduction in the per-minute cost of usage for
U.S. Cellular's network. In addition, data network and developer
costs increased driven by the increase in data usage; and
- expenses
incurred when U.S. Cellular's customers used other carriers'
networks while roaming increased $29.6 million, or 22%, in 2007,
and decreased $22.7 million, or 14%, in 2006. The increase in 2007
is due to an increase in roaming minutes of use partially offset by a
reduction in cost per minute which resulted from a reduction in
negotiated roaming rates, while the decrease in 2006 is primarily due
to a reduction in roaming rates negotiated with other carriers and the
elimination of roaming expenses incurred in previous periods when
U.S. Cellular customers traveled into non-U.S. Cellular
markets that are now operated by U.S. Cellular, partially offset
by increased usage.
Management
expects total system operations expenses to increase over the next few years, driven by the following factors:
- increases
in the number of cell sites within U.S. Cellular's systems as it
continues to add capacity and enhance quality in most markets and
continues development activities in recently launched markets; and
- increases
in minutes of use, both on U.S. Cellular's network and by
U.S. Cellular's customers on other carriers' networks when
roaming.
These
factors are expected to be partially offset by anticipated decreases in
the per-minute cost of usage both on U.S. Cellular's network and
on other carriers' networks.
Cost of equipment sold
The
increase in Cost of equipment sold in both years was due primarily to
an increase in the number of handsets sold (3% in 2007 and 12% in
2006), as discussed in Equipment sales revenues. In addition, the
increase was also driven by an increase in the average cost per handset
due to a shift to the sale of more expensive handsets with expanded
capabilities.
Selling, general and administrative expenses
Selling,
general and administrative expenses primarily consist of salaries,
commissions and expenses of field sales and retail personnel and
facilities; telesales department salaries and expenses; agent
commissions and related expenses; corporate marketing and merchandise
management; advertising; and public relations expenses. Selling,
general and administrative expenses also include the costs of operating
U.S. Cellular's customer care centers and the majority of
U.S. Cellular's corporate expenses.
The
increases in selling, general and administrative expenses in 2007 and
2006 are due primarily to higher expenses associated with acquiring,
serving and retaining customers, driven in part by an increase in
U.S. Cellular's customer base in both years; increased regulatory
charges and taxes also are a factor. Key components of the increases in
selling, general and administrative expenses were as follows:
2007–
- a
$53.9 million increase in expenses related to federal universal
service fund contributions and other regulatory fees and taxes due to
an increase in the contribution rate and an increase in service
revenues (most of the expenses related to universal service fund
contributions are offset by increases in retail service revenues for
amounts passed through to customers);
- a
$46.1 million increase in expenses related to compensation of
agents and sales employees to support growth in customers and revenues
in recently acquired and existing markets;
- a
$26.2 million increase in consulting and outsourcing costs as
U.S. Cellular increased its use of third parties to perform
certain functions and participate in certain projects;
- a
$20.5 million increase in advertising expenses primarily due to an increase in media purchases.
2006–
- a
$63.5 million increase in expenses related to sales employees and
agents. The increase in expenses related to sales employees and agents
was driven by the 14% increase in retail service revenues during 2006
compared to 2005 combined with a 4% increase in full-time equivalent
employees. In addition, initiatives focused on providing
wireless GPS enabled handsets to customers who did not previously
have such handsets contributed to higher sales employee-related and
agent-related commissions;
- a
$34.0 million increase in expenses primarily related to the
operations of U.S. Cellular's regional support offices, primarily
due to the increase in the customer base;
- a
$24.2 million increase in bad debt expense, reflecting both higher
revenues and slightly higher bad debts experience as a percent of
revenues;
- a
$19.8 million increase in advertising expenses related to
marketing of the U.S. Cellular brand in newly acquired and
launched markets as well as increases in spending for specific direct
marketing, segment marketing, product advertising and sponsorship
programs;
- an
$18.7 million increase in expenses related to universal service
fund contributions and other regulatory fees and taxes. Most of the
expenses related to universal service fund contributions are offset by
increases in retail service revenues for amounts passed through to
customers;
- a
$13.9 million increase in stock-based compensation expense
primarily due to the implementation of Statement of Financial
Accounting Standards ("SFAS") No. 123 (revised)
("SFAS 123(R)"), Share-Based Payment, as of January 1, 2006; and
- a
$7.7 million increase in consulting and outsourcing costs as
U.S. Cellular increased its use of third parties to perform
certain functions and participate in certain projects.
Sales
and marketing cost per gross customer addition was $487 in 2007
compared to $385 and $372 in 2006 and 2005, respectively. As discussed
in footnotes (4) and (5) in the table below, there was a change in
the reporting of reseller gross customer additions during 2007.
Excluding the impact of reseller gross customer additions for all
periods, sales and marketing cost per gross customer addition in 2007
was $578 compared to $510 and $507 in 2006 and 2005, respectively. The
increase in 2007 was primarily due to increased sales employee and
agent expenses as well as higher losses on sales of handsets. The
increase in 2006 is primarily due to increased agent-related expenses,
employee-related expenses and advertising expenses, partially offset by
reduced losses on sales of handsets.
Below
is a summary of sales and marketing cost per gross customer addition for each period:
Year Ended December 31,
|
|
2007 |
|
2006 |
|
2005 |
|
(Dollars in thousands, except per customer amounts)
|
|
|
|
| Components of cost: |
|
|
|
|
|
|
|
|
|
|
| |
Selling, general and administrative expenses related to the acquisition of new customers(1) |
|
$ |
677,615 |
|
$ |
612,086 |
|
$ |
551,236 |
|
| |
Cost of equipment sold to new customers(2) |
|
|
471,802 |
|
|
409,390 |
|
|
385,715 |
|
| |
Less equipment sales revenues from new customers(3) |
|
|
(291,447 |
) |
|
(287,962 |
) |
|
(228,095 |
) |
| Total cost |
|
$ |
857,970 |
|
$ |
733,514 |
|
$ |
708,856 |
|
| Gross customer additions (000s)(4) |
|
|
1,761 |
|
|
1,904 |
|
|
1,904 |
|
| Sales and marketing cost per gross customer addition(5) |
|
$ |
487 |
|
$ |
385 |
|
$ |
372 |
|
Year Ended December 31,
|
|
2007 |
|
2006 |
|
2005 |
|
| (Dollars in thousands) |
|
|
|
| Selling, general and administrative expenses, as reported |
|
$ |
1,555,639 |
|
$ |
1,399,561 |
|
$ |
1,217,709 |
|
| Less expenses related to serving and retaining customers |
|
|
(878,024 |
) |
|
(787,475 |
) |
|
(666,473 |
) |
| Selling, general and administrative expenses related to the acquisition of new customers |
|
$ |
677,615 |
|
$ |
612,086 |
|
$ |
551,236 |
|
Year Ended December 31,
|
|
2007 |
|
2006 |
|
2005 |
|
| (Dollars in thousands) |
|
|
|
| Cost of equipment sold as reported |
|
$ |
640,225 |
|
$ |
568,903 |
|
$ |
511,939 |
|
| Less cost of equipment sold related to the retention of existing customers |
|
|
(168,423 |
) |
|
(159,513 |
) |
|
(126,224 |
) |
| Cost of equipment sold to new customers |
|
$ |
471,802 |
|
$ |
409,390 |
|
$ |
385,715 |
|
Year Ended December 31,
|
|
2007 |
|
2006 |
|
2005 |
|
| (Dollars in thousands) |
|
|
|
| Equipment sales revenues, as reported |
|
$ |
267,027 |
|
$ |
258,745 |
|
$ |
203,743 |
|
| Less equipment sales revenues related to the retention of existing customers, excluding agent rebates |
|
|
(47,551 |
) |
|
(53,552 |
) |
|
(30,118 |
) |
| Add agent rebate reductions of equipment sales revenues related to the retention of existing customers |
|
|
71,971 |
|
|
82,769 |
|
|
54,470 |
|
| Equipment sales revenues from new customers |
|
$ |
291,447 |
|
$ |
287,962 |
|
$ |
228,095 |
|
Historically,
U.S. Cellular has reported the sales and marketing cost per gross
customer addition measurement to facilitate comparisons among companies
of the costs of acquiring customers on a per gross customer addition
basis and the efficiency of marketing efforts. Over time, many
companies have discontinued their reporting of this measurement. In
addition, sales and marketing cost per gross customer addition is not
calculable using financial information derived directly from the
Consolidated Statements of Operations, and the definition of sales and
marketing cost per gross customer addition used by U.S. Cellular
may not be comparable to similar measures that are reported by other
companies. Due to the decreasing relevance and use of the measurement,
as well as its complexity and lack of comparability among companies in
the wireless industry, U.S. Cellular will not report sales and
marketing cost per gross customer addition in the future.
Monthly
general and administrative expenses per customer, including the net
costs related to the renewal or upgrade of service contracts of
existing U.S. Cellular customers ("net customer retention costs"),
increased 4% to $14.88 in 2007 from $14.34 in 2006 and increased 10% in
2006 from $13.08 in 2005. The increase in 2007 is primarily due to an
increase in expense related to the federal universal service fund
contributions and other regulatory fees and taxes, an increase in
outside services and an increase in employee-related expenses
associated with serving and retaining customers. The increase in 2006
is due primarily to higher employee-related expenses associated with
serving and retaining customers and higher retention expenses related
to providing wireless GPS enabled handsets to customers
who did not previously have such handsets. In addition, in 2007 and
2006, U.S. Cellular recorded additional stock-based compensation
due primarily to the implementation of SFAS 123(R).
This
measurement is reconciled to total selling, general and administrative expenses as follows:
Year Ended December 31,
|
|
2007 |
|
2006 |
|
2005 |
|
| (Dollars in thousands, except per customer amounts) |
|
|
|
| Components of cost(1): |
|
|
|
|
|
|
|
|
|
|
| |
Selling, general and administrative expenses, as reported |
|
$ |
1,555,639 |
|
$ |
1,399,561 |
|
$ |
1,217,709 |
|
| |
Less selling, general and administrative expenses related to the acquisition of new customers |
|
|
(677,615 |
) |
|
(612,086 |
) |
|
(551,236 |
) |
| |
Add cost of equipment sold related to the retention of existing customers |
|
|
168,423 |
|
|
159,513 |
|
|
126,224 |
|
| |
Less equipment sales revenues related to the retention of existing customers, excluding agent rebates |
|
|
(47,551 |
) |
|
(53,552 |
) |
|
(30,118 |
) |
| |
Add agent rebate reductions of equipment sales revenues related to the retention of existing customers |
|
|
71,971 |
|
|
82,769 |
|
|
54,470 |
|
| Net cost of serving and retaining customers |
|
$ |
1,070,867 |
|
$ |
976,205 |
|
$ |
817,049 |
|
| Divided by average customers during period (000s)(2) |
|
|
5,997 |
|
|
5,671 |
|
|
5,207 |
|
| Divided by twelve months in each period |
|
|
12 |
|
|
12 |
|
|
12 |
|
| Average monthly general and administrative expenses per customer |
|
$ |
14.88 |
|
$ |
14.34 |
|
$ |
13.08 |
|
Depreciation expense
The
increases in both years reflect rising average fixed asset balances,
which increased 8% in 2007 and 12% in 2006. Increased fixed asset
balances in both 2007 and 2006 resulted from the following factors:
- the
addition of 434, 450 and 431 new cell sites to U.S. Cellular's
network in 2007, 2006 and 2005, respectively, built to expand and
improve coverage and capacity in U.S. Cellular's existing service
areas and;
- the
addition of radio channels and switching capacity to U.S. Cellular's network to accommodate increased usage.
See
"Financial Resources" and "Liquidity and Capital Resources" for further
discussions of U.S. Cellular's capital expenditures.
Amortization and accretion expenses
Amortization
expense decreased $24.9 million in 2007, primarily due to a
decrease in customer list amortization, and the billing system becoming
fully amortized in 2006. This was partly offset by a $4.0 million
increase in impairment in 2007. Of the $13.1 million increase in
amortization and accretion expense in 2006, $11.8 million is
attributable to amortization expense related to customer list
intangible assets acquired through various transactions in 2006 and the
fourth quarter of 2005. Customer list intangible assets are amortized
using the double declining balance method in the first year, switching
to the straight-line method in subsequent years.
Loss
on impairment of intangible assets totaled $4.0 million in 2007. In accordance with SFAS No. 142, Goodwill and Other Intangible
Assets
("SFAS 142"), U.S. Cellular performed the annual impairment
test for its investment in licenses in the second quarter of 2007. In
accordance with SFAS 142, U.S. Cellular performs the annual
impairment tests of licenses at the unit of accounting level.
U.S. Cellular's license impairments in 2007 were $2.1 million
and related to two of its six units of accounting in which operations
have not yet begun. Fair values for such units of accounting were
determined by reference to values established by auctions and other
market transactions involving licenses comparable to those included in
each specific unit of accounting. The 2006 and 2005 annual testing
resulted in no impairments. Also, U.S. Cellular performed an
impairment test for its customer lists in the third quarter of 2007.
Certain customer lists were identified as impaired, resulting in a
$1.9 million charge. No customer lists were impaired in 2006 or
2005.
In
accordance with SFAS No. 143, Accounting for Asset Retirement Obligations
("SFAS 143"), U.S. Cellular accretes liabilities for future
remediation obligations associated with leased properties. Such
accretion expense totaled $8.8 million in 2007, $7.2 million
in 2006 and $5.9 million in 2005.
(Gain) loss on asset disposals/exchanges
In
2007, 2006 and 2005, (gain)/loss on asset disposals/exchanges included
charges of $34.1 million, $19.6 million and
$20.4 million, respectively, related to disposals of assets,
trade-ins of older assets for replacement assets and other retirements
of assets from service. In 2007, U.S. Cellular conducted a
physical inventory of its significant cell site and switching assets.
As a result, (gain)/loss on asset disposals/exchanges included a charge
of $14.6 million in 2007 to reflect the results of the physical
inventory and related valuation and reconciliation.
In
2007, a $20.8 million pre-tax loss was recognized in conjunction
with the exchange of personal communication service license spectrum
with Sprint Nextel. There was no loss on exchange of assets in 2006 and
2005. In 2005, a pre-tax gain of $44.7 million represented the
difference between the fair value of the properties U.S. Cellular
received in the ALLTEL exchange transaction completed on
December 19, 2005 and the $58.1 million of cash paid plus the
recorded value of the assets it transferred to ALLTEL. Such amount of
gain was reduced to $42.4 million at the TDS consolidated level
due to the impact of the step acquisitions that resulted from
U.S. Cellular's repurchase of its Common Shares. See
Note 7–Acquisitions, Divestitures and Exchanges for the effect of
step acquisitions.
For
further discussion of these transactions, see "Liquidity and Capital Resources–Acquisitions, Divestitures and Exchanges."
Operating Income
Operating
margin increased 1.8 and 0.8 percentage points in 2007 and 2006,
respectively. The increases in operating income and operating income
margin were due to the fact that operating revenues increased more in
dollar and percentage terms, than operating expenses as a result of the
factors which are described in detail in Operating Revenues and
Operating Expenses above.
Effects of Competition
The
wireless telecommunications industry is highly competitive.
U.S. Cellular competes directly with several wireless
communications services providers in each of its markets. In general,
there are between three and five competitors in each wireless market in
which U.S. Cellular provides service, excluding resellers and
mobile virtual network operators ("MVNOs"). U.S. Cellular
generally competes against each of the nationwide wireless companies:
AT&T Mobility, Verizon Wireless, Sprint Nextel and
T-Mobile USA. However, not all of these competitors operate in all
markets where U.S. Cellular does business. U.S. Cellular
believes that these competitors have substantially greater financial,
technical, marketing, sales, purchasing and distribution resources than
it does. In addition, U.S. Cellular competes against both larger
and smaller regional wireless companies in certain areas, including
ALLTEL and Leap Wireless International, and resellers of wireless
services. Since U.S. Cellular's competitors do not disclose their
subscriber counts in specific regional service areas, market share for
the competitors in each regional market cannot be precisely determined.
The
use of national advertising and promotional programs by the national
wireless service providers may be a source of additional competitive
and pricing pressures in all U.S. Cellular markets, even if those
operators may not provide direct service in a particular market. Also,
in the current wireless environment, U.S. Cellular's ability to
compete depends on its ability to offer family and national calling
plans. U.S. Cellular provides wireless services comparable to the
national competitors, but the other wireless companies operate in a
wider geographic area and are able to offer no- or low-cost roaming and
long-distance calling packages over a wider area on their own networks
than U.S. Cellular can offer on its network. If U.S. Cellular
offers the same calling area as one of these competitors,
U.S. Cellular will incur roaming charges for calls made in
portions of the calling area that are not part of its network, thereby
increasing its cost of operations. In the Central Market Area,
U.S. Cellular's largest contiguous service area,
U.S. Cellular can offer larger regional service packages without
incurring significant roaming charges than it is able to offer in other
parts of its network.
Some
of U.S. Cellular's competitors bundle other services, such as a
combination of cable or satellite television service, high speed
internet, wireline phone service, and wireless phone service.
U.S. Cellular either does not have the ability to offer these
other services or has chosen not to offer them.
Since
each of these competitors operates on systems using spectrum licensed
by the FCC and has comparable technology and facilities, competition
within each market is principally on the basis of quality of service,
price, brand image, size of area covered, services offered and
responsiveness of customer service. U.S. Cellular employs a
customer satisfaction strategy throughout its markets which it believes
has contributed to a relatively low customer churn rate, and which it
also believes has had a positive impact on its cost to add a net new
customer.
2008 Estimates
U.S. Cellular
expects the above competitive factors to continue to have an effect on
operating income and operating income margin for the next several
quarters. Any changes in the above factors, as well as the effects of
other drivers of U.S. Cellular's operating results, may cause
operating income and operating income margin to fluctuate over the next
several quarters.
The
following are U.S. Cellular's estimates of full-year 2008 service
revenues; depreciation, amortization and accretion expenses; operating
income; net retail customer additions and capital expenditures. Such
estimates represent U.S. Cellular's views as of the date of filing
of U.S. Cellular's Form 10-K for the year ended
December 31, 2007. Such forward-looking statements should not be
assumed to be accurate as of any future date. TDS undertakes no duty to
update such information whether as a result of new information, future
events or otherwise. There can be no assurance that final results will
not differ materially from such estimated results.
|
|
2008
Estimated Results |
|
2007
Actual Results |
| Net retail customer additions |
|
250,000 - 325,000 |
|
301,000 |
| Service revenues |
|
$3,900 - $4,000 million |
|
$3,679.2 million |
| Operating income |
|
$460 - $535 million |
|
$396.2 million |
| Depreciation, amortization and accretion expenses(1) |
|
Approx. $615 million |
|
$637.1 million |
| Capital expenditures |
|
$590 - $640 million |
|
$565.5 million |
Results of Operations–Wireline Operations TDS
operates its wireline operations through TDS Telecom, a wholly
owned subsidiary. TDS Telecom served 1,197,700 equivalent access
lines at the end of 2007, a decrease of 15,800 lines from 2006. At the
end of 2006, TDS Telecom served 1,213,500 equivalent access lines,
an increase of 29,600 lines over 2005. Equivalent access lines are the
sum of the physical access lines and high-capacity data lines adjusted
to estimate the equivalent number of physical access lines in terms of
capacity. A physical access line is the individual circuit connecting a
customer to a telephone company's central office facilities. Each
digital subscriber line ("DSL") is treated as an equivalent line in
addition to a voice line that may operate off the same copper loop.
TDS Telecom
provides services through its incumbent local exchange carrier and
competitive local exchange carrier operations. An incumbent local
exchange carrier ("ILEC") is an independent local telephone company
that formerly had the exclusive right and responsibility to provide
local transmission and switching services in its designated service
territory. Competitive local exchange carrier ("CLEC") depicts
companies that enter the operating areas of incumbent local exchange
telephone companies to offer local exchange and other telephone
services.
TDS Telecom's
ILECs served 762,700 equivalent access lines at the end of 2007
compared to 757,300 at the end of 2006 and 735,300 at the end of 2005.
Since 2005, the ILEC operations have primarily grown through internal
growth.
TDS Telecom's
CLEC served 435,000 equivalent access lines at the end of 2007 compared
to 456,200 at the end of 2006 and 448,600 lines at the end of 2005. The
decline in 2007 is the result of a shift in focus from residential to
commercial customers. The growth in 2006 occurred as the CLEC
operations increased their presence in current markets.
Following
is a table of summarized operating data for TDS Telecom's ILEC and CLEC operations.
Customers
Year Ended December 31,
|
|
2007 |
|
2006 |
|
2005 |
| ILEC |
|
|
|
|
|
|
| |
Equivalent access lines |
|
762,700 |
|
757,300 |
|
735,300 |
| |
Dial-up Internet service accounts |
|
56,300 |
|
77,100 |
|
90,700 |
| |
Digital subscriber line (DSL) accounts |
|
143,500 |
|
105,100 |
|
65,500 |
| |
Long distance customers |
|
345,200 |
|
340,000 |
|
321,500 |
CLEC |
|
|
|
|
|
|
| |
Equivalent access lines |
|
435,000 |
|
456,200 |
|
448,600 |
| |
Dial-up Internet service accounts |
|
7,600 |
|
10,200 |
|
14,200 |
| |
Digital subscriber line (DSL) accounts |
|
43,300 |
|
42,100 |
|
36,400 |
Full-time equivalent TDS Telecom employees |
|
2,703 |
|
2,940 |
|
3,295 |
TDS Telecom
Components of Operating Income
Year Ended December 31,
|
|
2007 |
|
Increase/
(Decrease) |
|
Percentage
Change |
|
2006 |
|
Increase/
(Decrease) |
|
Percentage
Change |
|
2005 |
|
| (Dollars in thousands) |
|
|
|
| Operating revenues |
|
|
|
|
|
|
|
|
|
|
|
|
|
|
|
|
|
|
|
|
| |
ILEC revenues |
|
$ |
629,983 |
|
$ |
(15,542 |
) |
(2.4 |
)% |
$ |
645,525 |
|
$ |
(24,199 |
) |
(3.6 |
)% |
$ |
669,724 |
|
| |
CLEC revenues |
|
|
236,529 |
|
|
725 |
|
0.3 |
% |
|
235,804 |
|
|
(3,537 |
) |
(1.5 |
)% |
|
239,341 |
|
| |
Intra-company elimination |
|
|
(6,301 |
) |
|
(890 |
) |
(16.4 |
)% |
|
(5,411 |
) |
|
(431 |
) |
(8.7 |
)% |
|
(4,980 |
) |
| |
|
Telecom operating revenues |
|
|
860,211 |
|
|
(15,707 |
) |
(1.8 |
)% |
|
875,918 |
|
|
(28,167 |
) |
(3.1 |
)% |
|
904,085 |
|
Operating expenses |
|
|
|
|
|
|
|
|
|
|
|
|
|
|
|
|
|
|
|
|
| |
ILEC expenses |
|
|
502,593 |
|
|
(12,938 |
) |
(2.5 |
)% |
|
515,531 |
|
|
14,740 |
|
2.9 |
% |
|
500,791 |
|
| |
CLEC expenses |
|
|
222,717 |
|
|
(14,225 |
) |
(6.0 |
)% |
|
236,942 |
|
|
(10,607 |
) |
(4.3 |
)% |
|
247,549 |
|
| |
Intra-company elimination |
|
|
(6,301 |
) |
|
(890 |
) |
(16.4 |
)% |
|
(5,411 |
) |
|
(431 |
) |
(8.7 |
)% |
|
(4,980 |
) |
| |
|
Telecom operating expenses |
|
|
719,009 |
|
|
(28,053 |
) |
(3.8 |
)% |
|
747,062 |
|
|
3,702 |
|
0.5 |
% |
|
743,360 |
|
| TDS Telecom operating income |
|
$ |
141,202 |
|
$ |
12,346 |
|
9.6 |
% |
$ |
128,856 |
|
$ |
(31,869 |
) |
(19.8 |
)% |
$ |
160,725 |
|
Operating revenues
Operating
revenue decreased in 2007 and in 2006, primarily due to a decline in
ILEC revenues as a result of the decline in network access minutes of
use and lower compensation from state and national revenue pools.
Operating expenses
The
decrease in 2007 reflects cost reduction initiatives enacted by
TDS Telecom in 2006 and in 2007 and a shift in the targeted
customer base for the CLEC operations. The increase in 2006 was
primarily due to higher cost of providing services and products.
Operating income
The
increase in 2007 was primarily the result of cost reduction initiatives
enacted in 2006 and in 2007. The primary causes for the decrease in
2006 were the ILEC decrease in revenues generated from network usage
and lower average access rates coupled with higher costs of services
and products. TDS Telecom's total costs were also impacted by
stock based compensation which increased $9.3 million in 2006,
resulting primarily from the implementation of SFAS 123(R) as of
January 1, 2006.
2008 Guidance
The
following are estimates of full-year 2008 service revenues;
depreciation, amortization and accretion expenses and operating income.
Such forward-looking statements should not be assumed to be accurate as
of any future date. Such estimates represent TDS Telecom's view as
of the date of filing TDS' Form 10-K for the year ended
December 31, 2007. TDS undertakes no duty to update such
information whether as a result of new information, future events or
otherwise. There can be no assurance that final results will not differ
materially from these estimated results.
|
|
2008
Estimated Results |
|
2007
Actual Results |
| ILEC and CLEC Operations: |
|
|
|
|
| |
Operating revenues |
|
$815 - $855 million |
|
$860.2 million |
| |
Operating income |
|
$110 - $140 million |
|
$141.2 million |
| |
Depreciation, amortization and accretion expenses |
|
Approx. $160 million |
|
$157.5 million |
| |
Capital expenditures |
|
$130 - $160 million |
|
$128.2 million |
ILEC Operations
In
2007, TDS Telecom determined that it was no longer appropriate to
continue the application of SFAS 71 for reporting its financial
results. See Footnote 5–Extraordinary Item–Discontinuance of the
Application of Statement of Financial Accounting Standards No. 71,
Accounting for the Effects of Certain Types of Regulation.
TDS Telecom does not expect operating results in the future to be
materially impacted by the decision to discontinue the application of
SFAS 71.
Components of Operating Income
Year Ended December 31,
|
|
2007 |
|
Increase/
(Decrease) |
|
Percentage
Change |
|
2006 |
|
Increase/
(Decrease) |
|
Percentage
Change |
|
2005 |
| (Dollars in thousands) |
|
|
| Local service |
|
$ |
193,823 |
|
$ |
(6,390 |
) |
(3.2 |
)% |
$ |
200,213 |
|
$ |
(1,808 |
) |
(0.9 |
)% |
$ |
202,021 |
| Network access and long distance |
|
|
330,627 |
|
|
(21,672 |
) |
(6.2 |
)% |
|
352,299 |
|
|
(21,438 |
) |
(5.7 |
)% |
|
373,737 |
| Miscellaneous |
|
|
105,533 |
|
|
12,520 |
|
13.5 |
% |
|
93,013 |
|
|
(953 |
) |
(1.0 |
)% |
|
93,966 |
| Total operating revenues |
|
|
629,983 |
|
|
(15,542 |
) |
(2.4 |
)% |
|
645,525 |
|
|
(24,199 |
) |
(3.6 |
)% |
|
669,724 |
Cost of services and products (exclusive of depreciation, amortization and accretion included below) |
|
|
193,761 |
|
|
1,829 |
|
1.0 |
% |
|
191,932 |
|
|
14,680 |
|
8.3 |
% |
|
177,252 |
| Selling, general and administrative expense |
|
|
175,392 |
|
|
(12,837 |
) |
(6.8 |
)% |
|
188,229 |
|
|
(132 |
) |
(0.1 |
)% |
|
188,361 |
| Depreciation, amortization and accretion |
|
|
133,440 |
|
|
(1,930 |
) |
(1.4 |
)% |
|
135,370 |
|
|
192 |
|
0.1 |
% |
|
135,178 |
| Total operating expenses |
|
|
502,593 |
|
|
(12,938 |
) |
(2.5 |
)% |
|
515,531 |
|
|
14,740 |
|
2.9 |
% |
|
500,791 |
Total operating income |
|
$ |
127,390 |
|
$ |
(2,604 |
) |
(2.0 |
)% |
$ |
129,994 |
|
$ |
(38,939 |
) |
(23.0 |
)% |
$ |
168,933 |
Operating Revenues
Local service revenues (provision of local telephone exchange service primarily within the local
area):
Physical
access line decreases of 5% and 3% in 2007 and 2006 negatively impacted
revenues by $5.4 million in 2007 and $4.2 million in 2006.
Declines in second lines accounted for 19% and 34% of the decline in
physical access lines in 2007 and 2006. These second line
disconnections were significantly influenced by customers converting to
TDS Telecom's digital subscriber line ("DSL") service.
Interconnection revenues increased $2.4 million in 2007, but these
revenues were more than offset by lower revenues due to residential
bundling discounts. Revenues from the sale of custom calling and
advanced features increased $2.3 million and $1.5 million in
2007 and 2006, respectively.
Network access and long-distance revenues (compensation
for carrying interstate and intrastate long distance traffic on
TDS Telecom's local telephone networks and customer revenues from
reselling long-distance service):
For
both 2007 and 2006, revenue generated from network usage, including
compensation from state and national pools declined. In 2007,
$21.4 million of the decline in revenue was primarily due to
exiting the national revenue pool for DSL, a 14% decrease in access
minutes of use and a lower rate of return from the national revenue
pools. In 2006, $28.2 million of the decline in revenue was
primarily due to a 4.9% decrease in access minutes of use, a decrease
in revenues resulting from disputes with inter-exchange carriers and
lower average access rates.
Revenues
from reselling long-distance service did not change in 2007. The
revenue from the growth in the number of customers was offset by lower
average revenue per customer, due to an increase in discounts offered
to customers who subscribe to long-distance packages that are bundled
with other TDS Telecom telecommunication services. The increase of
$6.4 million in long-distance revenues in 2006 was due to the
growth in customers. As of December 31, 2007, TDS Telecom
ILEC operations were reselling
long-distance service on 345,200 access lines compared to 340,000 and
321,500 access lines at December 31, 2006 and 2005, respectively.
Miscellaneous revenues (charges
for providing Internet services; leasing, selling, installing and
maintaining customer premise equipment; providing billing and
collection services; and selling of direct broadcast satellite service
and other miscellaneous services):
DSL
revenues increased $17.6 million or 43% in 2007, but were offset
in part, by decreases in dial-up internet, and other non-regulated
service revenues. In 2006, DSL revenues increased $12.7 million or
44%, but were offset by decreases in dial-up internet, direct broadcast
satellite service and other non-regulated revenues. As of
December 31, 2007, TDS Telecom ILEC operations were providing
DSL service and dial-up internet service to 143,500 and 56,300
customers respectively, as compared to 105,100 DSL service customers
and 77,100 dial-up internet customers as of December 31, 2006.
Operating Expenses
Cost of services and products
The
increases in cost of services and products in 2007 and 2006 were
attributable to several factors. Network-related payroll expense
increased $2.7 million and $2.9 million in 2007 and 2006,
respectively. The payroll increase in 2007 was primarily due to
inflationary compensation increases while the payroll increase in 2006
was primarily due to an increase in stock-based compensation expense
resulting from adoption of SFAS 123(R) as of January 1, 2006
offset by the effects of the organizational realignment which occurred
in 2006. Also, line charges, circuit expenses and other cost of goods
sold associated with the growth in DSL customers increased by
$6.6 million in 2006, partially offset by a $2.4 million
decline in circuit and telephone expenses related to dial-up Internet
service. Cost of providing long-distance service, due to the growth in
long-distance customers combined with increased usage stimulated by
calling plans, increased 2006 expenses by $4.1 million. Cost of
goods sold related to business customer premises equipment and
reciprocal compensation expense decreased $1.1 million in 2007
after increasing by $1.3 million in 2006.
Selling, general and administrative expenses
Selling,
general and administrative expenses decreased in 2007 primarily due to
$7.2 million in payroll reductions due to cost reduction
initiatives enacted by TDS Telecom in 2006 and 2007. Stock based
compensation increased expenses by $6.1 million in 2006, due to
the adoption of SFAS 123(R) as of January 1, 2006.
Additionally, organizational realignment costs of $3.8 million
were incurred in 2006. Cost savings from the 2005 early retirement
incentive plan as well as a partial year benefit from the 2006
organizational realignment were primarily responsible for offsetting
these increases.
Depreciation, amortization and accretion expenses
Depreciation,
amortization and accretion expenses decreased in 2007 and were
relatively unchanged in 2006 compared to 2005, primarily attributable
to trends in new investments in plant and equipment. New investments in
plant and equipment decreased 1% in 2007 after increasing 16% in 2006.
Investments in switch modernization and outside plant facilities were
made to maintain and enhance the quality of service and to offer
TDS Telecom new revenue opportunities.
CLEC Operations
Components of Operating Income
Year Ended December 31,
|
|
2007 |
|
Increase/
(Decrease) |
|
Percentage
Change |
|
2006 |
|
Increase/
(Decrease) |
|
Percentage
Change |
|
2005 |
|
| (Dollars in thousands) |
|
|
|
| Retail revenue |
|
$ |
215,235 |
|
$ |
1,073 |
|
0.5 |
% |
$ |
214,162 |
|
$ |
(1,525 |
) |
(0.7 |
)% |
$ |
215,687 |
|
| Wholesale revenue |
|
|
21,294 |
|
|
(348 |
) |
(1.6 |
)% |
|
21,642 |
|
|
(2,012 |
) |
(8.5 |
)% |
|
23,654 |
|
| Total operating revenues |
|
|
236,529 |
|
|
725 |
|
0.3 |
% |
|
235,804 |
|
|
(3,537 |
) |
(1.5 |
)% |
|
239,341 |
|
Cost of services and products (exclusive of depreciation, amortization and accretion included below) |
|
|
116,612 |
|
|
(5,915 |
) |
(4.8 |
)% |
|
122,527 |
|
|
1,603 |
|
1.3 |
% |
|
120,924 |
|
| Selling, general and administrative expense |
|
|
82,083 |
|
|
(8,090 |
) |
(9.0 |
)% |
|
90,173 |
|
|
(6,014 |
) |
(6.3 |
)% |
|
96,187 |
|
| Depreciation, amortization and accretion |
|
|
24,022 |
|
|
(220 |
) |
(0.9 |
)% |
|
24,242 |
|
|
(6,196 |
) |
(20.4 |
)% |
|
30,438 |
|
| Total operating expenses |
|
|
222,717 |
|
|
(14,225 |
) |
(6.0 |
)% |
|
236,942 |
|
|
(10,607 |
) |
(4.3 |
)% |
|
247,549 |
|
Total operating income (loss) |
|
$ |
13,812 |
|
$ |
14,950 |
|
N/M |
|
$ |
(1,138 |
) |
$ |
7,070 |
|
86.1 |
% |
$ |
(8,208 |
) |
Operating Revenues
Retail revenues (charges to CLEC customers to whom TDS Telecom provides direct
telecommunication services):
The
2007 revenue growth was driven by the increase in the number of
commercial customers partially offset by a declining residential
customer base as a result of the shift in focus from residential to
commercial customers. Additionally, the 2007 increase was due to the
growth in average revenue per customer resulting from an increased
penetration of higher margin commercial products and less discounting
on residential products. The 2% growth in equivalent access lines in
2006 resulted in increased revenues by $7.2 million in 2006. This
increase was more than offset by lower average revenue per customer in
2006 resulting from competitive pressures on voice and data services
pricing.
Wholesale revenues (charges to other carriers for utilizing TDS Telecom's network
infrastructure):
Wholesale
revenues remained flat for 2007 with a 13% decline in minutes of use
offset by a 13% increase in the average revenue per minute attributable
to the mix of traffic. The decrease in 2006 is primarily due to lower
average access rates caused by a change in the mix of traffic and an
increase in revenue disputes with inter-exchange carriers.
Operating Expenses
Cost of services and products
The
decrease in 2007 is primarily due to a change in the mix of products
and customers served by the CLEC, improved pricing received on certain
services purchased and a reduction in payroll-related costs. In 2006,
additional expenses of $6.9 million related to access line growth
were mostly offset by lower costs, due in large part to more efficient
network routing arrangements. In 2006, the CLEC also recognized a
$5.1 million reduction in expenses resulting from favorable
settlements with inter-exchange carriers. However, 2006 was
$5.3 million higher than 2005 due to a favorable settlement with
an incumbent carrier recorded in 2005, which reduced 2005 expense.
Selling, general and administrative expense
The
decrease in 2007 was primarily due to a decrease of $3.6 million
in advertising expense formerly targeted at residential customers, a
$3.7 million reduction in payroll costs due to a 10% decrease in
the number of employees, partially offset by wage increases, and a
reduction of bad debt expense
of $1.4 million. In 2006, the reduction in expense was primarily
caused by changes in the mix of customers and consolidation of customer
service and provisioning functions, which resulted in $4.7 million
lower payroll-related expenses, and $1.9 million lower sales and
marketing expenses. This decrease was partially offset by a
$2.0 million increase in stock-based compensation expense
resulting from the adoption of SFAS 123(R) as of January 1,
2006.
Depreciation, amortization and accretion expenses
The
2006 decrease was the result of the 2004 change in the estimated
remaining lives of certain long-lived assets, which resulted in several
asset categories becoming fully depreciated in 2006.
Inflation
Management
believes that inflation affects TDS' business to no greater extent than
the general economy.
Recent Accounting Pronouncements In September 2006, the FASB issued SFAS No. 157, Fair Value Measurements
("SFAS 157"). SFAS 157 defines fair value as used in numerous
accounting pronouncements, establishes a framework for measuring fair
value in U.S. GAAP, and expands disclosures related to the use of
fair value measures in financial statements. SFAS 157 does not
expand the use of fair value measurements in financial statements, but
standardizes its definition and guidance in U.S. GAAP.
SFAS 157 emphasizes that fair value is a market-based measurement
and not an entity-specific measurement, based on an exchange
transaction in which the entity sells an asset or transfers a liability
(exit price). SFAS 157 establishes a fair value hierarchy from
observable market data as the highest level to an entity's own fair
value assumptions about market participant assumptions as the lowest
level. In February 2008, the FASB issued FASB Staff Position ("FSP")
FAS 157-1 to exclude leasing transactions from the scope of
SFAS 157. In February 2008, the FASB also issued FSP
FAS 157-2 to defer the effective date of SFAS 157 for all
nonfinancial assets and liabilities, except those items recognized or
disclosed at fair value on an annual or more frequently recurring
basis, until years beginning after November 15, 2008. TDS adopted
SFAS 157 for its financial assets and liabilities effective
January 1, 2008 and does not anticipate any material impact on its
financial position or results of operations. TDS has not yet adopted
SFAS 157 for its nonfinancial assets and liabilities. TDS is
currently reviewing the adoption requirements related to its
nonfinancial assets and liabilities and has not yet determined the
impact, if any, on its financial position or results of operations.
In
September 2006, the FASB ratified EITF No. 06-1, Accounting for Consideration Given by a Service Provider to Manufacturers or Resellers of
Equipment Necessary for an End-Customer to Receive Service from the Service Provider ("EITF 06-1"). This guidance requires the application of
EITF 01-9, Accounting for Consideration Given by a Vendor to a Customer
("EITF 01-9"), when consideration is given to a reseller or
manufacturer to benefit the service provider's end customer.
EITF 01-9 requires that the consideration given be recorded as a
liability at the time of the sale of the equipment and also provides
guidance for the classification of the expense. TDS adopted
EITF 06-1 effective January 1, 2008 with no material impact
on its financial position or results of operations.
In
February 2007, the FASB issued SFAS No. 159, The Fair Value Option for Financial Assets and Financial Liabilities, Including an Amendment of FASB
Statement No. 115
("SFAS 159"). SFAS 159 permits entities to choose to measure
many financial instruments and certain other items at fair value at
specified election dates. Unrealized gains and losses on items for
which the fair value option has been elected shall be reported in
earnings at each subsequent reporting date. SFAS 159 also
establishes presentation and disclosure requirements designed to
facilitate comparisons between entities that choose different
measurement attributes for similar types of assets and liabilities. TDS
adopted SFAS 159 on January 1, 2008 and is electing the fair
value option for its Deutsche Telekom marketable equity securities
and related derivative liabilities. As a result of the election, TDS
anticipates recognizing a $502.7 million cumulative-effect gain
adjustment to retained earnings (net of $291.2 million of tax) in
the first quarter of 2008.
In
December 2007, the FASB issued SFAS No. 141 (revised 2007), Business Combinations–a replacement of FASB Statement
No. 141 ("SFAS 141(R)"). SFAS 141(R) replaces FASB Statement No. 141, Business Combinations
("SFAS 141"). SFAS 141(R) retains the underlying concept of
SFAS 141 in that all business combinations are still required to
be accounted for at fair value under the acquisition method, a method
that requires the acquirer to measure and recognize the acquiree on an
entire entity basis and recognize the assets acquired and liabilities
assumed at their fair values as of the date of acquisition. However,
SFAS 141(R) changes the method of applying the acquisition method
in a number of significant aspects. SFAS 141(R) is effective on a
prospective basis for all business combinations for which the
acquisition date is on or after January 1, 2009, with the
exception of the accounting for valuation allowances on deferred taxes
and acquired tax contingencies. SFAS 141(R) amends SFAS
No. 109, Accounting for Income Taxes,
such that amendments made to valuation allowances on deferred taxes and
acquired tax contingencies associated with acquisitions that closed
prior to the effective date of SFAS 141(R) would also apply the
provisions of SFAS 141(R). TDS is currently reviewing the
requirements of SFAS 141(R) and has not yet determined the impact,
if any, on its financial position or results of operations.
In
December 2007, the FASB issued SFAS No.160, Consolidated Financial Statements, Including Accounting and Reporting of Noncontrolling Interests in
Subsidiaries–a replacement of ARB
No. 51 ("SFAS 160"). SFAS 160 amends Accounting Research Bulletin No. 51, Consolidated Financial
Statements, as amended by FASB Statement No. 94, Consolidation of All Majority-Owned Subsidiaries,
to establish new standards that will govern the accounting and
reporting of (1) noncontrolling interests (commonly referred to as
minority interests) in partially owned consolidated subsidiaries and
(2) the loss of control of subsidiaries. It also establishes that
once control of a subsidiary is obtained, changes in ownership
interests in that subsidiary that do not result in a loss of control
shall be accounted for as equity transactions, not as step
acquisitions. SFAS 160 is effective on a prospective basis for
TDS' 2009 financial statements, except for the presentation and
disclosure requirements, which will be applied retrospectively. TDS is
currently reviewing the requirements of SFAS 160 and has not yet
determined the impact on its financial position or results of
operations.
TDS
operates a capital- and marketing-intensive business. In recent years,
TDS has generated cash from its operating activities, received cash
proceeds from divestitures, used short-term credit facilities and used
long-term debt financing to fund its construction costs and operating
expenses. TDS anticipates further increases in wireless customers,
revenues and operating expenses, cash flows from operating activities
and capital expenditures in the future. Cash flows may fluctuate from
quarter to quarter and from year to year due to seasonality, capital
expenditures and other factors.
The
following table provides a summary of TDS' cash flow activities for the periods shown.
Year Ended December 31,
|
|
2007 |
|
2006 |
|
2005 |
|
| (Dollars in thousands) |
|
|
| Cash flows from (used in) |
|
|
|
|
|
|
|
|
|
|
| |
Operating activities |
|
$ |
941,032 |
|
$ |
892,246 |
|
$ |
868,212 |
|
| |
Investing activities |
|
|
(627,855 |
) |
|
(630,740 |
) |
|
(902,417 |
) |
| |
Financing activities |
|
|
(152,056 |
) |
|
(343,972 |
) |
|
(41,109 |
) |
| Net increase (decrease) in cash and cash equivalents |
|
$ |
161,121 |
|
$ |
(82,466 |
) |
$ |
(75,314 |
) |
Cash Flows From Operating Activities
represent a significant source of funds to TDS. Net cash provided by
operating activities, excluding changes in assets and liabilities from
operations totaled $949.9 million in 2007, $1,011.8 million
in 2006 and $926.8 million in 2005. Distributions from
unconsolidated investments provided $87.4 in 2007, $78.2 million
in 2006 and $52.6 million in 2005. Changes in assets and
liabilities from operations required $8.9 million in 2007,
$119.6 million in 2006 and $58.6 million in 2005, reflecting
higher net working capital balances required to support higher levels
of business activity as well as differences in timing and collection of
payments.
Cash Flows From Investing Activities
primarily represent uses of funds to construct, operate and upgrade
modern high-quality communications networks and facilities as a basis
for creating long-term value for shareholders and to acquire licenses
and properties. In recent years, rapid changes in technology and new
opportunities have required substantial investments in
revenue-enhancing and cost-reducing upgrades to TDS' networks. Proceeds
from merger and divestiture transactions, and sales of investments have
provided funds in recent years, which have partially offset the cash
requirements for investing activities; however, such sources cannot be
relied upon to provide continuing or regular sources of financing.
The
primary purpose of TDS' construction and expansion expenditures is to
provide for customer growth, to upgrade service, to launch new market
areas, and to take advantage of service-enhancing and cost-reducing
technological developments in order to maintain competitive services.
Consolidated
cash expenditures for capital additions required $699.6 million in
2007, $722.5 million in 2006 and $710.5 million in 2005.
U.S. Cellular's capital additions totaled $565.5 million in
2007, $579.8 million in 2006 and $576.5 million in 2005.
These expenditures were made to fund construction of 434, 450 and 431
new cell sites in 2007, 2006 and 2005, respectively, increases in
capacity in existing cell sites and switches, remodeling of new and
existing retail stores and opening new stores, and costs related to the
development of U.S. Cellular's office systems.
TDS Telecom's
capital additions for its ILEC operations totaled $111.8 million
in 2007, $113.2 million in 2006 and $97.5 million in 2005,
representing expenditures for switch modernization and outside plant
facilities to maintain and enhance the quality of service and offer new
services with revenue opportunities. TDS Telecom's capital
expenditures for CLEC operations totaled $16.4 million in 2007,
$17.3 million in 2006 and $27.1 million in 2005 for switching
and other network facilities.
Corporate
and other capital expenditures totaled $5.9 million in 2007, $12.2 million in 2006 and $9.4 million in 2005.
Acquisitions
required $23.8 million, $145.9 million and
$191.4 million in 2007, 2006 and 2005, respectively. TDS'
acquisitions included primarily the purchase of controlling interests
in wireless markets, minority interests that increased the ownership of
majority-owned markets and wireless spectrum. Divestitures provided
$4.3 million, $102.3 million and $0.5 million in 2007,
2006 and 2005, respectively. See "Acquisitions, Divestitures and
Exchanges" in the Liquidity and Capital Resources section for details
regarding transactions completed in each of these years.
During
2007, in connection with the settlement of the variable prepaid forward
contracts related to TDS' VeriSign Inc. Common Shares, a portion
of TDS' Deutsche Telekom ordinary shares, and TDS' subsidiaries
Vodafone ADRs, the remaining shares of each of these investments were
sold with pre-tax proceeds totaling $92.0 million. See "Marketable
Equity Securities and Forward Contracts" section in Liquidity and
Capital Resources for further details.
In
the past, TDS Telecom obtained financing from the Rural Telephone
Bank ("RTB"). In connection with such financings, TDS Telecom
purchased stock in the RTB. TDS Telecom repaid all of its debt to
the RTB, but continued to own the RTB stock. In August 2005, the board
of directors of the RTB approved resolutions to liquidate and dissolve
the RTB. In order to effect the dissolution and liquidation,
shareholders were asked to remit their shares to receive cash
compensation for those shares. TDS Telecom
remitted its shares and received $101.7 million from the RTB in the second quarter of 2006.
At
an Extraordinary General Meeting held on July 25, 2006,
shareholders of Vodafone approved a Special Distribution of –0.15 per
share (–1.50 per ADR) and a Share Consolidation under which every 8
ADRs of Vodafone were consolidated into 7 ADRs. As a result of the
Special Distribution which was paid on August 18, 2006,
U.S. Cellular and TDS Telecom received approximately
$28.6 million and $7.6 million, respectively, in cash; these
amounts, representing a return of capital for financial statement
purposes, were recorded as a reduction in the accounting cost basis of
marketable equity securities, and were included in cash flows from
investing activities in 2006.
Cash Flows From Financing Activities
primarily reflect issuances and repayments of short-term debt, proceeds
from issuance of long-term debt and from entering into variable prepaid
forward contracts, repayments of long-term debt and repurchases of
common shares. TDS has used short-term debt to finance acquisitions, to
repurchase common shares and for other general corporate purposes. Cash
flows from operating activities, proceeds from forward contracts and,
from time to time, the sale of non-strategic cellular and other
investments have been used to reduce short-term debt. In addition, from
time to time, TDS has used proceeds from the issuance of long-term debt
to reduce short-term debt.
On
August 1, 2006, TDS repaid $200.0 million plus accrued
interest on its 7% unsecured senior notes. Also, in 2006, TDS redeemed
$35.0 million of medium-term notes which carried interest rates of
10% and redeemed $17.2 million of medium-term notes which carried
interest rates of 9.25% to 9.35% in 2005.
In
2005, TDS issued $116.3 million of 6.625% senior notes due March
2045 which provided proceeds after underwriting discounts of
$112.6 million. Also in 2005, TDS Telecom repaid
approximately $232.6 million of Rural Utilities Service ("RUS"),
Rural Telephone Bank ("RTB") and Federal Financing Bank ("FFB") notes.
Borrowings
under revolving credit facilities totaled $25.0 million in 2007,
primarily to fund capital expenditures, $415.0 million in 2006,
primarily to fund capital expenditures and $510.0 million in 2005,
primarily to repay long-term debt and fund capital expenditures.
Repayments under the revolving credit facilities totaled
$60.0 million in 2007, $515.0 million in 2006 and
$405.0 million in 2005.
Proceeds
received from the re-issuances of treasury shares in connection with
employee benefit plans at TDS provided $113.6 million in 2007,
$24.8 million in 2006 and $20.2 million in 2005. Proceeds
received from the re-issuances of treasury shares in connection with
employee benefit plans at U.S. Cellular provided
$10.1 million in 2007, $15.9 million in 2006 and
$23.3 million in 2005.
Dividends
paid on TDS Common Stock and Preferred Shares, excluding dividends
reinvested, totaled $45.8 million in 2007, $43.0 million in
2006 and $40.6 million in 2005. Payment for repurchase of TDS
Common Shares was $126.7 million in 2007. TDS did not repurchase
any Common Shares in 2006 and 2005. U.S. Cellular's repurchase of
Common Shares totaled $87.9 million in 2007. U.S. Cellular
did not repurchase any Common Shares in 2006 and 2005.
See
"Repurchase of Securities and Dividends" section in Liquidity and
Capital Resources for information on TDS and U.S. Cellular share
repurchases.
Liquidity and Capital Resources TDS
believes that cash flows from operating activities, existing cash
balances and funds available from the revolving credit facilities
provide substantial financial flexibility for TDS to meet both its
short- and long-term needs for the foreseeable future. In addition, TDS
and its subsidiaries may have access to public and private capital
markets to help meet their long-term financing needs.
However,
the availability of external financial resources is dependent on
economic events, business developments, technological changes,
financial conditions or other factors, some of which are not in TDS'
control. If at any time financing is not available on terms acceptable
to TDS, TDS might be required to reduce its business development and
capital expenditure plans, which could have a materially adverse effect
on its business and financial condition. TDS cannot provide assurances
that circumstances that could materially adversely affect TDS'
liquidity or capital resources will not occur. Economic downturns,
changes in financial markets or other factors could affect TDS'
liquidity and availability of capital resources. Uncertainty of access
to capital for telecommunications companies, deterioration in the
capital markets, other changes in market conditions or other factors
could limit or restrict the availability of financing on terms and
prices acceptable to TDS, which could require TDS to reduce its
construction, development and acquisition programs.
Cash and Cash Equivalents
As
of December 31, 2007, TDS had $1,174.4 million in cash and
cash equivalents, which include cash and short-term, highly liquid
investments with original maturities of three months or less. The
primary objective of our cash and cash equivalents investment
activities is to preserve principal. We currently invest our cash
primarily in money market funds that are rated in the highest
short-term rating category by major rating agencies such as Moody's and
Standard and Poor's. Management believes that the credit risk
associated with these investments is minimal.
Revolving Credit Facilities
As
discussed below, TDS and its subsidiaries had $1,296.4 million of
revolving credit facilities available for general corporate purposes as
well as an additional $25 million of bank lines of credit as of
December 31, 2007.
TDS
has a $600 million revolving credit facility available for general
corporate purposes. At December 31, 2007, outstanding letters of
credit were $3.4 million, leaving $596.6 million available
for use. Borrowings under the revolving credit facility bear interest
at the London InterBank Offered Rate ("LIBOR") plus a contractual
spread based on TDS' credit rating. TDS may select borrowing periods of
either seven days or one, two, three or six months. At
December 31, 2007, one-month LIBOR was 4.60% and the contractual
spread was 75 basis points. If TDS provides less than two days' notice
of intent to borrow, the related borrowings bear interest at the prime
rate less 50 basis points (the prime rate was 7.25% at
December 31, 2007). In 2007, TDS paid fees at an aggregate annual
rate of 0.40% of the total $600 million facility. These fees
totaled $2.4 million, $2.0 million and $0.8 million for
the years ended December 31, 2007, 2006 and 2005, respectively.
This credit facility expires in December 2009.
TDS
also had $25 million in direct bank lines of credit at
December 31, 2007, all of which were unused. The terms of the
direct bank lines of credit provide for borrowings at negotiated rates
up to the prime rate (the prime rate was 7.25% at December 31,
2007).
U.S. Cellular
has a $700 million revolving credit facility available for general
corporate purposes. At December 31, 2007, outstanding letters of
credit were $0.2 million, leaving $699.8 million available
for use. Borrowings under the revolving credit facility bear interest
at the LIBOR plus a contractual spread based on U.S. Cellular's
credit rating. U.S. Cellular may select borrowing periods of
either seven days or one, two, three or six months. If
U.S. Cellular provides less than two days' notice of intent to
borrow, the related borrowings bear interest at the prime rate less 50
basis points. U.S. Cellular paid fees at an aggregate
annual rate of 0.39% of the total facility in 2007. These fees totaled
$2.8 million in 2007, $2.3 million in 2006 and
$1.0 million in 2005. This credit facility expires in December
2009.
The
financial covenants associated with TDS' and U.S. Cellular's lines
of credit require that each company maintain certain debt-to-capital
and interest coverage ratios. The covenants of U.S. Cellular's
revolving credit facility prescribe certain terms associated with
intercompany loans from TDS or TDS subsidiaries to U.S. Cellular
or U.S. Cellular subsidiaries.
TDS'
and U.S. Cellular's interest costs on their revolving credit
facilities as of December 31, 2007 would increase if their credit
ratings from either Standard & Poor's Rating Services
("Standard & Poor's") or Moody's Investor Service ("Moody's")
were lowered and decrease if ratings improved. However, their credit
facilities would not cease to be available or accelerate solely as a
result of a decline in their credit ratings. A downgrade in TDS' or
U.S. Cellular's credit ratings could adversely affect their
ability to renew existing, or obtain access to new, credit facilities
in the future. TDS' and U.S. Cellular's credit ratings as of
December 31, 2007, and the dates such credit ratings were issued,
were as follows:
| Moody's (Issued September 20, 2007) |
Baa3 |
–stable outlook |
| Standard & Poor's (Issued June 21, 2007) |
BB+ |
–with developing outlook |
| Fitch (Issued August 16, 2007) |
BBB+ |
–stable outlook |
On
September 20, 2007, Moody's changed its outlook on TDS and
U.S. Cellular's credit rating to stable from under review for
possible further downgrade.
On
February 13, 2007, Standard & Poor's lowered its credit
ratings on TDS and U.S. Cellular to BBB- from BBB. The ratings
remained on credit watch with negative implications. On April 23,
2007, Standard & Poor's lowered its credit rating on TDS and
U.S. Cellular to BB+ from BBB-. The ratings remained on credit
watch with negative implications. On June 21, 2007,
Standard & Poor's affirmed the BB+ rating, and removed the
company from credit watch. The outlook is developing.
On
August 16, 2007, Fitch changed its outlook on TDS and
U.S. Cellular's credit rating to stable from ratings watch
negative.
The
maturity dates of certain TDS and U.S. Cellular revolving credit
facilities would accelerate in the event of a change in control.
The
continued availability of the revolving credit facilities requires TDS
and U.S. Cellular to comply with certain negative and affirmative
covenants, maintain certain financial ratios and represent certain
matters at the time of each borrowing. As noted in Note 14–Notes
Payable in the Notes to the Consolidated Financial Statements, TDS and
U.S. Cellular were in default of the revolving credit facilities
during 2007 due to restatements and late SEC filings. TDS and
U.S. Cellular received waivers of such defaults and subsequently
made all required filings and ceased to be in default. TDS and
U.S. Cellular believe they were in compliance as of
December 31, 2007 with all covenants and other requirements set
forth in the revolving credit facilities.
Long-Term Financing
TDS
believes it and its subsidiaries were in compliance as of
December 31, 2007 with all covenants and other requirements set
forth in long-term debt indentures. Such indentures do not contain any
provisions resulting in acceleration of the maturities of outstanding
debt in the event of a change in TDS' credit rating. However, a
downgrade in TDS' credit rating could adversely affect its ability to
obtain long-term debt financing in the future. As stated in
Note 15–Long-Term Debt and Forward Contracts to the Notes to the
Consolidated Financial Statements, TDS and U.S. Cellular were not
in compliance with debt indentures due to restatements and late SEC
filings. However, this non-compliance did not result in an event of
default or a default.
Marketable Equity Securities and Forward Contracts
TDS
and its subsidiaries hold or previously held marketable equity
securities that are publicly traded and can have volatile movements in
share prices. TDS and its subsidiaries do not make direct investments
in publicly traded companies and all of these interests were acquired
as a result of sales, trades or reorganizations of other assets.
The
investment in Deutsche Telekom AG ("Deutsche Telekom") resulted
from TDS' disposition of its over 80%-owned personal communications
services operating subsidiary, Aerial Communications, Inc., to
VoiceStream in exchange for stock of VoiceStream, which was then
acquired by Deutsche Telekom in exchange for Deutsche Telekom stock.
The prior investment in Vodafone Group Plc ("Vodafone") resulted
from certain dispositions of non-strategic wireless investments to or
settlements with AirTouch Communications, Inc. ("AirTouch") in
exchange for stock of AirTouch, which was then acquired by Vodafone
whereby TDS and its subsidiaries received American Depositary Receipts
representing Vodafone stock. The prior investment in
VeriSign, Inc. ("VeriSign") is the result of the acquisition by
VeriSign of Illuminet, Inc., a telecommunications entity in which
several TDS subsidiaries held interests. The investment in Rural
Cellular Corporation ("RCCC") is the result of a consolidation of
several wireless partnerships in which TDS subsidiaries held interests
in RCCC, and the distribution of RCCC stock in exchange for these
interests. The tax basis of each investment is significantly below its
current market value; therefore, disposition of the investments would
result in significant taxable gains.
As
of December 31, 2007 and 2006, TDS and its subsidiaries owned
719,396 shares of RCCC. On July 30, 2007, RCCC announced that
Verizon Wireless had agreed to purchase the outstanding shares of RCCC
for $45 per share in cash. The acquisition is expected to close in the
first half of 2008. If the transaction closes, TDS will receive
approximately $32.4 million in cash, recognize a
$31.7 million pre-tax gain and cease to own any interest in RCCC.
TDS
has a number of variable prepaid forward contracts ("forward
contracts") with counterparties related to the Deutsche Telekom stock
that it holds. The forward contracts mature from January to September
2008 and, at TDS' option, may be settled in shares of the respective
securities or cash. If shares are delivered in the settlement of the
forward contract, TDS would incur a current tax liability at the time
of delivery. Deferred taxes have been provided for the difference
between the book basis and the tax basis of the marketable equity
securities and are included in deferred tax liabilities on the
Consolidated Balance Sheets. As of December 31, 2007, such current
deferred income tax liabilities related to marketable equity securities
totaled $625.4 million.
Additional
forward contracts related to the Deutsche Telekom ordinary shares held
by TDS matured in July through September 2007. The loan amounts
associated with these forward contracts were $516.9 million. TDS
elected to deliver a substantial majority of the 45,492,172 Deutsche
Telekom ordinary shares in settlement of the forward contracts, and to
dispose of all of its remaining Deutsche Telekom ordinary shares
related to such forward contracts in exchange for $81.2 million in
cash. TDS recognized a pre-tax gain of $248.9 million in 2007 on
the settlement of such forward contracts and the disposition of the
remaining shares. TDS incurred a current tax liability in the amount of
$176.5 million at the time of delivery and sale of the remaining
shares. After these forward contracts were settled in July through
September 2007, TDS owns 85,969,689 of the Deutsche Telekom ordinary
shares and has a derivative liability of $711.7 million under the
related forward contracts at December 31, 2007. TDS will determine
whether to settle the remaining forward contracts in shares or in cash
at a time closer to the maturity dates.
The
forward contracts related to TDS' subsidiaries' Vodafone ADRs matured
in May and October 2007. The loan amounts associated with these forward
contracts were $201.0 million. TDS' subsidiaries elected to
deliver a substantial majority of the Vodafone ADRs in settlement of
the forward contracts, and disposed of all remaining Vodafone ADRs
related to such forward contracts in exchange for $4.6 million in
cash. TDS recorded a pre-tax gain of $171.6 million in 2007 on the
settlement of such forward contracts and the disposition of such
remaining shares. As a result of the settlement of these forward contracts
in May and October 2007, TDS' subsidiaries no longer own any Vodafone
ADRs and no longer have any liability or other obligations under the
related forward contracts. TDS incurred a current tax liability in the
amount of $47.3 million at the time of the delivery and sale of
the remaining shares.
The
forward contracts related to TDS' VeriSign Common Shares matured in May
2007. The loan amounts associated with these forward contracts were
$20.8 million. TDS elected to deliver a substantial majority of
the VeriSign Common Shares in settlement of the forward contracts, and
to dispose of all remaining VeriSign Common Shares related to such
forward contracts in exchange for $6.2 million in cash. TDS
recorded a pre-tax gain of $6.2 million in the second quarter of
2007 on the settlement of such forward contracts and the disposition of
such remaining VeriSign Common Shares. As a result of the settlement of
these forward contracts in May 2007, TDS no longer owns any VeriSign
Common Shares and no longer has any liability or other obligations
under the related forward contracts. TDS incurred a current tax
liability in the amount of $7.9 million at the time of the
delivery and sale of the remaining shares.
TDS
is and until May 2007 U.S. Cellular was required to comply with
certain covenants under the forward contracts. As noted in
Note 15–Long-Term Debt and Forward Contracts in the Notes to the
Consolidated Financial Statements, TDS and U.S. Cellular were in
default of certain forward contracts due to restatements and late SEC
filings. TDS and U.S. Cellular received waivers of such defaults
and subsequently made all required filings and ceased to be in default.
TDS believes that it was in compliance as of December 31, 2007
with all covenants and other requirements set forth in its forward
contracts. U.S. Cellular did not have any forward contracts as of
December 31, 2007.
The
following table details the outstanding forward contracts related to
the Deutsche Telekom stock and maturity dates of the contracts as of
December 31, 2007.
Marketable Equity Security
|
|
Shares |
|
Loan Amounts
(Dollars in thousands) |
|
Maturity Date |
| Deutsche Telekom AG |
|
30,000,000 |
|
$ |
340,963 |
|
First Quarter 2008 |
Deutsche Telekom AG |
|
38,000,000 |
|
|
452,105 |
|
Second Quarter 2008 |
| |
Unamortized Discount |
|
|
|
|
(3,829 |
) |
|
| |
|
|
|
|
448,276 |
|
|
Deutsche Telekom AG |
|
17,969,689 |
|
|
222,297 |
|
Third Quarter 2008 |
| |
Unamortized Discount |
|
|
|
|
(6,024 |
) |
|
| |
|
|
|
|
216,273 |
|
|
| |
|
|
|
$ |
1,005,512 |
|
|
Assuming
the delivery of shares upon settlement of all of the other forward
contracts and sale of the remaining shares and based on the fair market
value of the marketable equity securities and the related derivative
liabilities as of December 31, 2007, TDS would be required to pay
federal and state income taxes of approximately $349.7 million
related to settlements in 2008. The amount of income taxes payable
related to 2008 settlements will change upon settlement of the forward
contracts as the marketable equity securities and the related
derivative liabilities will be valued as of the settlement date, not
December 31, 2007.
Deutsche
Telekom paid a dividend of EUR 0.72 per share in May 2007. Using a
weighted-average exchange rate of $1.36 per EUR, TDS recorded dividend
income of $128.5 million, before taxes, in the second quarter of
2007.
Capital Expenditures
U.S. Cellular's
estimated capital expenditures for 2008 are approximately
$590 - 640 million. These expenditures primarily address
the following needs:
- Expand
and enhance U.S. Cellular's coverage in its service areas.
- Provide
additional capacity to accommodate increased network usage by existing customers.
- Enhance
U.S. Cellular's retail store network and office systems.
TDS Telecom's
estimated capital expenditures for 2008 are approximately
$130 million to $160 million to provide for normal growth and
to upgrade plant and equipment to provide enhanced services.
TDS
plans to finance its capital expenditures program using cash on hand, cash flows from operating activities and short-term debt.
Acquisitions, Divestitures and Exchanges
TDS
assesses its existing wireless and wireline interests on an ongoing
basis with a goal of improving competitiveness of its operations and
maximizing its long-term return on investment. As part of this
strategy, TDS reviews attractive opportunities to acquire additional
operating markets, telecommunications companies and wireless spectrum.
In addition, TDS may seek to divest outright or include in exchanges
for other wireless interests those markets and wireless interests that
are not strategic to its long-term success. TDS may from time-to-time
be engaged in negotiations relating to the acquisition, divestiture or
exchange of companies, strategic properties or wireless spectrum. In
addition, TDS may participate as a bidder, or member of a bidding
group, in auctions administered by the FCC.
Auction 73
From
time to time, the FCC conducts auctions through which additional
spectrum is made available for the provision of wireless services. The
FCC previously auctioned some spectrum in the 700 megahertz band.
An FCC auction of additional spectrum in the 700 megahertz band,
designated by the FCC as Auction 73, began on January 24,
2008. U.S. Cellular is participating in Auction 73 indirectly
through its interest in King Street Wireless, L.P. ("King Street
Wireless"), which is participating in Auction 73. A subsidiary of
U.S. Cellular is a limited partner in King Street Wireless. King
Street Wireless intends to qualify as a "designated entity," and
thereby be eligible for bid credits with respect to spectrum purchased
in Auction 73.
In
January 2008, U.S. Cellular made capital contributions and
advances to King Street Wireless and/or its general partner of
$97 million to allow King Street Wireless to participate in
Auction 73. King Street Wireless is in the process of developing
its long-term business and financing plans. Pending finalization of
King Street Wireless' permanent financing plans, and upon request by
King Street Wireless, U.S. Cellular may agree to make additional
capital contributions and/or advances to King Street Wireless and/or
its general partner. U.S. Cellular will consolidate King Street
Wireless and King Street Wireless, Inc., the general partner of
King Street Wireless, for financial reporting purposes, pursuant to the
guidelines of FIN 46(R), as U.S. Cellular anticipates
benefiting from or absorbing a majority of King Street Wireless'
expected gains or losses.
FCC
anti-collusion rules place certain restrictions on business
communications and disclosures by participants in an FCC auction. As
noted above, Auction 73 began on January 24, 2008. If certain
reserve prices are not met, the FCC will follow Auction 73 with a
contingent auction, referred to as Auction 76. For purposes of
applying its anti-collusion rules, the FCC has determined that both
auctions will be treated as a single auction, which means that, in the
event that the contingent auction is needed, the anti-collusion rules
would last from the application deadline for Auction 73, which was
December 3, 2007, until the deadline by which winning bidders in
Auction 76 must make the required down payment. The
FCC anti-collusion rules place certain restrictions on business
communications with other companies and on public disclosures relating
to U.S. Cellular's participation in an FCC auction. For instance,
these anti-collusion rules may restrict the normal conduct of
U.S. Cellular's business and/or disclosures by U.S. Cellular
relating to the auctions, which could last 3 to 6 months or more.
As of the time of filing this report, Auction 73 was still in
progress.
There
is no assurance that King Street Wireless will be successful in the
auctions or that acceptable spectrum will be available at acceptable
prices in the auction. If King Street Wireless is successful in
Auction 73, it may be required to raise additional capital through
a combination of additional debt and/or equity financing. In such case,
U.S. Cellular may make additional capital contributions to King
Street Wireless and/or its general partner to provide additional
funding of any licenses granted to King Street Wireless pursuant to
Auction 73. The possible amount of such additional capital
contributions is not known at this time but could be substantial. In
such case, U.S. Cellular may finance such amounts from cash on
hand, from borrowings under its revolving credit agreement and/or
long-term debt. There is no assurance that U.S. Cellular will be
able to obtain such additional financing on commercially reasonable
terms or at all.
2007 Activity
Transactions Pending as of December 31, 2007:
On
December 3, 2007, U.S. Cellular entered into an agreement to
acquire six 12 megahertz C block lower 700 megahertz
licenses in Maine for $5.0 million in cash. This transaction is
expected to close in 2008.
On
November 30, 2007, TDS entered into an agreement to acquire an
incumbent local exchange carrier serving 750 equivalent access lines
for $6.6 million, subject to a working capital adjustment. The
transaction closed in February 2008.
On
November 30, 2007, U.S. Cellular entered into an exchange
agreement with Sprint Nextel which calls for U.S. Cellular to
receive personal communication service ("PCS") spectrum in eight
licenses covering portions of four states (Oklahoma, West Virginia,
Maryland and Iowa) and in exchange for U.S. Cellular to deliver
PCS spectrum in eight licenses covering portions of Illinois. The
exchange of licenses will provide U.S. Cellular with additional
spectrum to meet anticipated future capacity and coverage requirements
in several of its key markets. Six of the licenses that
U.S. Cellular will receive will add spectrum in areas where
U.S. Cellular currently provides service and two of the licenses
are in areas that will provide incremental population of approximately
88,000. The eight licenses that U.S. Cellular will deliver are in
areas where U.S. Cellular currently provides service and has what
it considers an excess of spectrum (i.e., it has more spectrum
than is expected to be needed to continue to provide high quality
service). No cash, customers, network assets or other assets or
liabilities will be included in the exchange, which is expected to be
completed during the first half of 2008. As a result of this exchange
transaction, TDS recognized a pre-tax loss on exchange of assets of
$20.8 million during 2007.
Transactions Completed as of December 31, 2007:
On
December 3, 2007, U.S. Cellular acquired a 12 megahertz
C block lower 700 megahertz license in Kansas for
$3.2 million in cash.
On
February 1, 2007, U.S. Cellular purchased 100% of the
membership interests of Iowa 15 Wireless, LLC
("Iowa 15") and obtained the 25 megahertz FCC cellular
license to provide wireless service in Iowa Rural Service Area ("RSA")
15 for approximately $18.2 million in cash. This acquisition
increased investments in licenses, goodwill and customer lists by
$7.9 million, $5.9 million and $1.6 million,
respectively. The goodwill of $5.9 million is deductible for
income tax purposes.
In
addition, in 2007, TDS Telecom and Suttle Straus each acquired a
company for cash, which purchases aggregated to $2.3 million.
These acquisitions increased goodwill by $1.8 million of which
$1.0 million is deductible for income tax purposes.
In
aggregate, the 2007 acquisitions, divestitures and exchanges increased
licenses by $11.1 million, goodwill by $7.7 million and
customer lists by $1.6 million.
2006 Activity
U.S. Cellular
is a limited partner in Barat Wireless, L.P. ("Barat Wireless"),
an entity which participated in the auction of wireless spectrum
designated by the FCC as Auction 66. Barat Wireless was qualified
to receive a 25% bid credit available to "very small businesses",
defined as businesses having annual gross revenues of less than
$15 million. At the conclusion of the auction on
September 18, 2006, Barat Wireless was the successful bidder with
respect to 17 licenses for which it had bid $127.1 million,
net of its bid credit. On April 30, 2007, the FCC granted Barat
Wireless' applications with respect to the 17 licenses for which
it was the successful bidder. These 17 license areas cover portions of
20 states and are in markets which are either adjacent to or
overlap current U.S. Cellular licensed areas.
Barat
Wireless is in the process of developing its long-term business and
financing plans. As of December 31, 2007, U.S. Cellular had
made capital contributions and advances to Barat Wireless and/or its
general partner of $127.2 million, which are included in Licenses
in the Consolidated Balance Sheets. Barat Wireless used the funding to
pay the FCC an initial deposit of $79.9 million on July 14,
2006 to allow it to participate in Auction 66. On October 18,
2006, Barat Wireless paid the balance due at the conclusion of the
auction for the licenses with respect to which Barat Wireless was the
successful bidder; such amount totaled $47.2 million. For
financial statement purposes, U.S. Cellular consolidates Barat
Wireless and Barat Wireless, Inc., the general partner of Barat
Wireless, pursuant to the guidelines of FASB Interpretation
No. 46(R), Consolidation of Variable Interest Entities,
an interpretation of ARB No. 51, ("FIN 46(R)"), as
U.S. Cellular anticipates benefiting from or absorbing a majority
of Barat Wireless' expected gains or losses. Pending finalization of
Barat Wireless' permanent financing plan, and upon request by Barat
Wireless, U.S. Cellular may agree to make additional capital
contributions and advances to Barat Wireless and/or its general
partner.
In
October 2006, U.S. Cellular's interest in Midwest Wireless
Communications, LLC ("Midwest Wireless") was sold to ALLTEL
Corporation. In connection with the sale, U.S. Cellular became
entitled to receive approximately $106.0 million in cash with
respect to its interest in Midwest Wireless. Of this amount,
$95.1 million was distributed upon closing and $10.9 million
was held in escrow to secure certain true-up, indemnification and other
possible adjustments; the funds held in escrow were to be distributed
in installments over a period of four to fifteen months following the
closing. During 2007, U.S. Cellular received $4.0 million of
funds that were distributed from the escrow, plus interest of
$0.3 million. On January 8, 2008, U.S. Cellular received
a final distribution from the escrow of $6.3 million, plus
interest of $0.5 million.
In
April 2006, U.S. Cellular purchased the remaining ownership
interest in a Tennessee wireless market, in which it had previously
owned a 16.7% interest, for approximately $18.9 million in cash.
This acquisition increased investments in licenses, goodwill and
customer lists by $5.5 million, $4.0 million and
$2.0 million, respectively. The $4.0 million of goodwill is
not deductible for income tax purposes.
In
aggregate, the 2006 acquisitions, divestitures and exchanges increased
licenses by $132.7 million, goodwill by $4.1 million and
customer lists by $2.0 million.
2005 Activity
On
December 19, 2005, U.S. Cellular completed an exchange of
certain wireless markets in Kansas, Nebraska and Idaho with a
subsidiary of ALLTEL. Under the agreement, U.S. Cellular acquired
fifteen Rural
Service Area ("RSA") markets in Kansas and Nebraska in exchange for two
RSA markets in Idaho and $57.1 million in cash, as adjusted.
U.S. Cellular also capitalized $2.6 million of
acquisition-related costs. In connection with the exchange,
U.S. Cellular recorded a pre-tax gain of $44.7 million in
2005. This gain was reduced to $42.4 million at the TDS
consolidated level as TDS allocated additional U.S. Cellular step
acquisition goodwill of $2.3 million to the markets divested, and
is included in (Gain) loss on exchange and sales of assets in the
Consolidated Statements of Operations. The gain represented the excess
of the fair value of assets acquired and liabilities assumed over the
sum of cash and net carrying value of assets and liabilities delivered
in the exchange.
U.S. Cellular
is a limited partner in Carroll Wireless L.P. ("Carroll
Wireless"), an entity which participated in the auction of wireless
spectrum designated by the FCC as Auction 58. Carroll Wireless was
qualified to bid on "closed licenses" that were available only to
companies included under the FCC definition of "entrepreneurs," which
are small businesses that have a limited amount of assets and revenues.
In addition, Carroll Wireless bid on "open licenses" that were not
subject to restriction. With respect to these licenses, however,
Carroll Wireless was qualified to receive a 25% bid credit available to
"very small businesses" which were defined as having average annual
gross revenues of less than $15 million. Carroll Wireless was a
successful bidder for 16 licenses in Auction 58, which ended
on February 15, 2005. The aggregate amount paid to the FCC for the
16 licenses was $129.7 million, net of the bid credit to
which Carroll Wireless was entitled. These 16 licenses cover
portions of 10 states and are in markets which are either adjacent
to or overlap current U.S. Cellular licensed areas.
Carroll
Wireless is in the process of developing its long-term business and
financing plans. As of December 31, 2007, U.S. Cellular had
made capital contributions and advances to Carroll Wireless and/or its
general partner of approximately $129.9 million; of this amount,
$129.7 million is included in Licenses in the Consolidated Balance
Sheets. For financial statement purposes, U.S. Cellular
consolidates Carroll Wireless and Carroll PCS, Inc., the
general partner of Carroll Wireless, pursuant to the guidelines of
FIN 46(R), as U.S. Cellular anticipates benefiting from or
absorbing a majority of Carroll Wireless' expected gains or losses.
Pending finalization of Carroll Wireless' permanent financing plan, and
upon request by Carroll Wireless, U.S. Cellular may agree to make
additional capital contributions and advances to Carroll Wireless
and/or its general partner. U.S. Cellular has approved additional
funding of $1.4 million of which $0.1 million was provided to
Carroll Wireless as of December 31, 2007.
In
the first quarter of 2005, TDS adjusted the previously reported gain
related to its sale to ALLTEL of certain wireless properties on
November 30, 2004. The adjustment of the gain, which resulted from
a working capital adjustment that was finalized in the first quarter of
2005, increased the total gain on the sale by $0.5 million to
$51.4 million.
In
addition, in 2005, U.S. Cellular purchased one new wireless market
and certain minority interests in other wireless markets in which it
already owned a controlling interest for $6.9 million in cash. As
a result of these acquisitions, U.S. Cellular's Licenses, Goodwill
and Customer lists were increased by $3.9 million,
$0.3 million and $1.2 million, respectively.
In
aggregate, the 2005 acquisitions, divestitures and exchanges increased
Licenses by $136.3 million, Goodwill by $28.2 million and
Customer lists by $32.7 million.
Repurchase of Securities and Dividends
On
March 2, 2007, the TDS Board of Directors authorized the
repurchase of up to $250 million of TDS Special Common Shares from
time to time through open market purchases, block transactions, private
purchases or otherwise. This authorization will expire on March 2,
2010. As of December 31, 2007, TDS repurchased 2,076,979 Special
Common Shares for $126.7 million, or an average of $60.99 per
share pursuant to this authorization. TDS did not repurchase any common
shares in 2006 or 2005.
The
Board of Directors of U.S. Cellular has authorized the repurchase
of up to 1% of the outstanding U.S. Cellular Common Shares held by
non-affiliates on a quarterly basis, primarily for use in employee
benefit plans (the "Limited Authorization"). This authorization does
not have an expiration date.
On
March 6, 2007, the Board of Directors of U.S. Cellular
authorized the repurchase of up to 500,000 Common Shares of
U.S. Cellular (the "Additional Authorization") from time to time
through open market purchases, block transactions, private transactions
or other methods. This authorization was in addition to
U.S. Cellular's existing Limited Authorization discussed above,
and was scheduled to expire on March 6, 2010. However, because
this authorization was fully utilized in connection with the
April 4, 2007 accelerated share repurchases discussed below, no
further purchases are available under this authorization.
U.S. Cellular
entered into accelerated share repurchase ("ASR") agreements to
purchase its shares through an investment banking firm in private
transactions. The repurchased shares are held as treasury shares. In
connection with each ASR, the investment banking firm purchased an
equivalent number of shares in the open-market over time. Each program
was required to be completed within two years of the trade date of the
respective ASR. At the end of each program, U.S. Cellular received
or paid a price adjustment based on the average price of shares
acquired by the investment banking firm pursuant to the ASR during the
purchase period, less a negotiated discount. The purchase price
adjustment could be settled, at U.S. Cellular's option, in cash or
in U.S. Cellular Common Shares.
Activity
related to U.S. Cellular's repurchases of shares through ASR
transactions on April 4, July 10 and October 25, 2007,
and its obligations to the investment banking firm, are detailed in the
table below.
(Dollars in thousands, except per share amounts)
|
|
April 4,
2007 |
|
July 10,
2007 |
|
October 25,
2007 |
|
Totals |
|
| Number of Shares Repurchased by U.S. Cellular(1) |
|
|
670,000 |
|
|
168,000 |
|
|
168,000 |
|
|
1,006,000 |
|
| |
Initial purchase price to investment banking firm |
|
$ |
49,057 |
|
$ |
16,145 |
|
$ |
16,215 |
|
$ |
81,417 |
|
| |
Weighted average price of initial purchase(2) |
|
$ |
73.22 |
|
$ |
96.10 |
|
$ |
96.52 |
|
$ |
80.93 |
|
ASR Settled as of December 31, 2007(3) |
|
|
|
|
|
|
|
|
|
|
|
|
|
| |
Additional amount paid to investment banking firm |
|
$ |
6,485 |
|
|
– |
|
|
– |
|
$ |
6,485 |
|
| |
Final total cost of shares |
|
$ |
55,542 |
|
|
– |
|
|
– |
|
$ |
55,542 |
|
| |
Final weighted average price |
|
$ |
82.90 |
|
|
– |
|
|
– |
|
$ |
82.90 |
|
| |
Number of shares purchased by investment banking firm and settled |
|
|
670,000 |
|
|
– |
|
|
– |
|
|
670,000 |
|
Number of Shares Purchased by Investment Banking Firm for Open ASRs (As of December 31, 2007) |
|
|
– |
|
|
63,665 |
|
|
– |
|
|
63,665 |
|
| |
|
Average price of shares, net of discount, purchased by investment banking firm |
|
|
– |
|
$ |
85.70 |
|
|
– |
|
$ |
85.70 |
|
| |
|
(Refund due) from investment banking firm for shares purchased through December 31, 2007(4) |
|
|
– |
|
$ |
(661 |
) |
|
– |
|
$ |
(661 |
) |
| |
|
Equivalent number of shares that would be delivered by investment banking firm based on December 31, 2007 closing price(5) |
|
|
– |
|
|
7,861 |
|
|
– |
|
|
7,861 |
|
Settlement of ASRs Subsequent to December 31, 2007(6) |
|
|
|
|
|
|
|
|
|
|
|
|
|
| |
(Refund) paid by investment banking firm |
|
|
– |
|
$ |
(2,080 |
) |
$ |
(2,474 |
) |
$ |
(4,554 |
) |
| |
Final total cost of shares, less discount plus commission |
|
|
– |
|
$ |
14,065 |
|
$ |
13,741 |
|
$ |
27,806 |
|
| |
Final weighted average price(2) |
|
|
– |
|
$ |
83.72 |
|
$ |
81.79 |
|
$ |
82.76 |
|
TDS'
ownership percentage of U.S. Cellular increases upon such
U.S. Cellular share repurchases. Therefore, TDS accounts for
U.S. Cellular's purchases of U.S. Cellular Common Shares as
step acquisitions using purchase accounting. All of the ASRs were
settled in cash and resulted in an adjustment to TDS' Capital in excess
of par value upon the respective settlements.
TDS
paid total dividends on its Common Shares and Special Common Shares and
Preferred Shares of $45.8 million in 2007, $43.0 million in
2006 and $40.6 million in 2005. TDS paid quarterly dividends per
share of $0.0975 in 2007 and $0.0925 in 2006. TDS has no current plans
to change its policy of paying dividends.
Contractual and Other Obligations
At
December 31, 2007, the resources required for scheduled repayment
of contractual obligations were as follows:
|
|
Payments due by Period |
|
|
Total |
|
Less than
1 Year |
|
2 - 3 Years |
|
4 - 5 Years |
|
More than
5 Years |
| (Dollars in millions) |
|
|
| Long-term debt obligations(1) |
|
$ |
1,636.1 |
|
$ |
3.9 |
|
$ |
19.4 |
|
$ |
1.2 |
|
$ |
1,611.6 |
| Long-term debt interest |
|
|
3,465.6 |
|
|
120.0 |
|
|
238.0 |
|
|
236.7 |
|
|
2,870.9 |
| Forward contract obligations(2) |
|
|
1,015.4 |
|
|
1,015.4 |
|
|
– |
|
|
– |
|
|
– |
| Forward contract interest(3) |
|
|
6.6 |
|
|
6.6 |
|
|
– |
|
|
– |
|
|
– |
| Operating leases(4) |
|
|
960.5 |
|
|
127.0 |
|
|
207.7 |
|
|
137.1 |
|
|
488.7 |
| Capital leases |
|
|
2.6 |
|
|
0.6 |
|
|
0.4 |
|
|
0.4 |
|
|
1.2 |
| Purchase obligations(5)(6)(7) |
|
|
668.0 |
|
|
372.9 |
|
|
192.0 |
|
|
52.3 |
|
|
50.8 |
| |
|
$ |
7,754.8 |
|
$ |
1,646.4 |
|
$ |
657.5 |
|
$ |
427.7 |
|
$ |
5,023.2 |
The
Contractual and Other Obligations table above does not include any
liabilities related to unrecognized tax benefits under FIN 48
since TDS is unable to reasonably predict the ultimate amount or timing
of settlement of such FIN 48 liabilities. See Note 4–Income
Taxes in the Notes to Consolidated Financial Statements for additional
information on unrecognized tax benefits.
Sale of Certain Accounts Receivable
In
December 2006, U.S. Cellular entered into an agreement to sell
$226.0 million face amount of accounts receivable written off in
previous periods; the proceeds from the sale were $5.9 million.
The agreement transferred all rights, title, and interest in the
account balances, along with the right to collect all amounts due, to
the buyer. The sale was subject to a 180-day period in which the buyer
was entitled to request a refund for any unenforceable accounts. The
transaction was recognized as a sale during the fourth quarter of 2006
in accordance with the provisions of SFAS No. 140, Accounting for
Transfers and Servicing of Financial Assets and Extinguishments of Liabilities,
with the gain deferred until expiration of the recourse period. During
the second quarter of 2007, U.S. Cellular recognized a gain of
$5.0 million, net of refunds for unenforceable accounts. The gain
is included in Selling, general and administrative expense in the
Consolidated Statements of Operations. All expenses related to the
transaction were recognized in the period incurred.
Off-Balance Sheet Arrangements
TDS
has no transactions, agreements or contractual arrangements with
unconsolidated entities involving "off-balance sheet arrangements," as
defined by SEC rules, that have or are reasonably likely to have a
material current or future effect on financial condition, changes in
financial condition, results of operations, cash flows from operating
activities, liquidity, capital resources, or financial flexibility.
Investments in Unconsolidated Entities. TDS
has certain investments in unconsolidated entities that represent
variable interests. The investments in unconsolidated entities totaled
$206.4 million as of December 31, 2007, and are accounted for
using either the equity or cost method. TDS' maximum loss exposure for
these variable interests is limited to the aggregate carrying amount of
the investments.
Indemnity Agreements. TDS
enters into agreements in the normal course of business that provide
for indemnification of counterparties. These include certain asset
sales and financings with other parties. The terms of the
indemnification vary by agreement. The events or circumstances that
would require TDS to perform under these indemnities are transaction
specific; however, these agreements may require TDS to indemnify the
counterparty for costs and losses incurred from litigation or claims
arising from the underlying transaction. TDS is unable to estimate the
maximum potential liability for these types of indemnifications as the
amounts are dependent on the outcome of future events, the nature and
likelihood of which cannot be determined at this time. Accordingly, no
amounts have been recorded in the
financial statements related to such agreements. Historically, TDS has
not made any significant indemnification payments under such
agreements.
Application of Critical Accounting Policies and Estimates TDS
prepares its consolidated financial statements in accordance with
accounting principles generally accepted in the United States of
America ("U.S. GAAP"). TDS' significant accounting policies are
discussed in detail in Note 1–Summary of Significant Accounting
Policies of the Notes to the Consolidated Financial Statements included
in TDS' Form 10-K for the year ended December 31, 2007.
The
preparation of financial statements in accordance with U.S. GAAP
requires management to make estimates and assumptions that affect the
reported amounts of assets and liabilities and disclosures of
contingent assets and liabilities at the date of the financial
statements and the reported amounts of revenues and expenses during the
reporting period. Management bases its estimates on historical
experience and on various other assumptions and information that are
believed to be reasonable under the circumstances, the results of which
form the basis for making judgments about the carrying values of assets
and liabilities. Actual results may differ from estimates under
different assumptions or conditions.
Management
believes the following critical accounting estimates reflect its more
significant judgments and estimates used in the preparation of its
consolidated financial statements. Management has discussed the
development and selection of each of the following accounting policies
and estimates and the following disclosures with the audit committee of
TDS' Board of Directors.
Revenue Recognition
U.S. Cellular
Service
revenues are recognized as earned and equipment revenues are recognized
when title passes to the agent or end-user customer. U.S. Cellular
recognizes revenue for access charges and other services charged at
fixed amounts ratably over the service period, net of credits and
adjustments for service discounts, billing disputes and fraud or
unauthorized usage. U.S. Cellular recognizes revenue related to
usage in excess of minutes provided in its rate plans at contractual
rates per minute as minutes are used; revenue related to long distance
service is recognized in the same manner. Additionally,
U.S. Cellular recognizes revenue related to data usage based on
contractual rates per kilobyte as kilobytes are used; revenue based on
per-use charges, such as for the use of premium services, is recognized
as the charges are incurred. As a result of its multiple billing cycles
each month, U.S. Cellular is required to estimate the amount of
subscriber revenues earned but not billed or billed but not earned from
the end of each billing cycle to the end of each reporting period.
These estimates are based primarily upon historical billed minutes.
U.S. Cellular's revenue recognition policies are in accordance
with the Securities and Exchange Commission's ("SEC") Staff Accounting
Bulletin ("SAB") No. 104, Revenue Recognition and FASB Emerging Issues Task Force Issue No. 00-21, Revenue Arrangements with Multiple
Deliverables.
TDS Telecom
Service
revenues are recognized as services are rendered. TDS Telecom
recognizes revenue for local exchange service, internet services and
digital broadcast satellite service commissions at fixed amounts
ratably over the service period, net of credits and adjustments for
service discounts. TDS' ILECs participate in revenue pools with other
telephone companies for interstate revenue and for certain intrastate
revenue. Such pools are funded by toll revenue and/or access charges
within state jurisdictions and by access charges in the interstate
market. Revenues earned through the various pooling processes are
recorded based on estimates following the National Exchange Carrier
Association's rules as approved by the FCC. TDS Telecom recognizes
revenue related to carrying non-pooled intrastate long distance
traffic, billing and collection services and long distance services
based on actual usage and contracted
rates. As a result of the cutoff times of its multiple billing cycles
each month, TDS Telecom is required to estimate the amount of
revenues earned but not billed and billed but not earned at the end of
each reporting period. These estimates are based primarily upon
historical billed minutes or usage.
Accounting for the Effects of Certain Types of Regulation
Historically,
TDS Telecom's ILEC operations followed the accounting for
regulated enterprises prescribed by SFAS 71. This accounting
recognizes the economic effects of rate-making actions of regulatory
bodies in the financial statements of the TDS Telecom ILEC
operations.
TDS Telecom
has regularly monitored the appropriateness of the application of
SFAS 71. Recent changes in TDS Telecom's business environment
have caused competitive forces to surpass regulatory forces such that
TDS Telecom has concluded that it is no longer reasonable to
assume that rates set at levels that will recover the enterprise's cost
can be charged to its customers. TDS Telecom has experienced
increasing access line losses due to increasing levels of competition
across all of the ILEC service areas. Competition has intensified in
2007 from cable and wireless operators which have extended their
investment beyond major markets to enable a broader range of voice and
data services that compete directly with TDS Telecom's service
offerings. These alternative telecommunications providers have
transformed a pricing structure historically based on the recovery of
costs to a pricing structure based on market conditions. Consequently,
TDS Telecom has had to alter its strategy to compete in its
markets. Specifically, in the third quarter of 2007, TDS Telecom
initiated an aggressive program of service bundling and deep
discounting and has made the decision to voluntarily exit certain
revenue pools administered by the FCC-supervised National Exchange
Carrier Association in order to achieve additional pricing flexibility
to meet competitive pressures.
Based
on these material factors impacting its operations, management
determined in the third quarter of 2007 that it is no longer
appropriate to continue the application of SFAS 71 for reporting
its financial results. Accordingly, TDS Telecom recorded a
non-cash extraordinary gain of $42.8 million, net of taxes of
$27.0 million, upon discontinuance of the provisions of
SFAS 71, as required by the provisions of SFAS No. 101, Regulated Enterprises–Accounting for the
Discontinuation of the
Application of FASB Statement No. 71. The components of the non-cash extraordinary gain are as follows:
|
|
Before
Tax Effects |
|
After
Tax Effects |
|
| (in thousands) |
|
|
|
| Write off of regulatory cost of removal |
|
$ |
70,107 |
|
$ |
43,018 |
|
| Write off of other net regulatory assets |
|
|
(259 |
) |
|
(191 |
) |
| Total |
|
$ |
69,848 |
|
$ |
42,827 |
|
In
conjunction with the discontinuance of SFAS 71, TDS Telecom
has assessed the useful lives of fixed assets and determined that the
impacts of any changes were not material.
Licenses and Goodwill
As
of December 31, 2007, TDS reported $1,517 million of licenses
and $679 million of goodwill, as a result of acquisitions of
interests in wireless licenses and businesses, the acquisition of
operating telephone companies, and step acquisitions related to
U.S. Cellular's repurchase of U.S. Cellular Common Shares.
Licenses include those won by Barat Wireless in FCC Auction 66
completed in September 2006 and by Carroll Wireless in FCC
Auction 58 completed in February 2005.
See
Note 8–Licenses and Goodwill in the Notes to Consolidated
Financial Statements for a schedule of license and goodwill activity in
2007 and 2006.
Licenses
and goodwill must be reviewed for impairment annually, or more
frequently if events or changes in circumstances indicate that the
asset might be impaired. TDS performs the annual impairment
review on licenses and goodwill during the second quarter of its fiscal
year. There can be no assurance that upon review at a later date
material impairment charges will not be required.
The
intangible asset impairment test consists of comparing the fair value
of the intangible asset to the carrying amount of the intangible asset.
If the carrying amount exceeds the fair value, an impairment loss is
recognized for the difference. The goodwill impairment test is a
two-step process. The first step compares the fair value of the
reporting unit as identified in accordance with SFAS No. 142, Goodwill and Other Intangible Assets
("SFAS 142") to its carrying value. If the carrying amount exceeds
the fair value, the second step of the test is performed to measure the
amount of impairment loss, if any. The second step compares the implied
fair value of reporting unit goodwill with the carrying amount of that
goodwill. To calculate the implied fair value of goodwill, an
enterprise allocates the fair value of the reporting unit to all of the
assets and liabilities of that reporting unit (including any
unrecognized intangible assets) as if the reporting unit had been
acquired in a business combination and the fair value was the price
paid to acquire the reporting unit. The excess of the fair value of the
reporting unit over the amounts assigned to the assets and liabilities
of the reporting unit is the implied fair value of goodwill. If the
carrying amount of goodwill exceeds the implied fair value of goodwill,
an impairment loss of goodwill is recognized for that difference.
The
fair value of an asset or reporting unit is the amount at which that
asset or reporting unit could be bought or sold in a current
transaction between willing parties. Therefore, quoted market prices in
active markets are the best evidence of fair value and should be used
when available. If quoted market prices are not available, the estimate
of fair value is based on the best information available, including
prices for similar assets and the use of other valuation techniques.
Other valuation techniques include present value analysis, multiples of
earnings or revenues or similar performance measures. The use of these
techniques involves assumptions by management about factors that are
highly uncertain including future cash flows, the appropriate discount
rate and other inputs. Different assumptions for these inputs or
valuation methodologies could create materially different results.
U.S. Cellular
tests goodwill for impairment at the level of reporting referred to as
a reporting unit. For purposes of impairment testing of goodwill in
2007 and 2006, U.S. Cellular identified five reporting units
pursuant to paragraph 30 of SFAS 142. The five reporting
units represent five geographic groupings of FCC licenses, constituting
five geographic service areas.
For
purposes of impairment testing of goodwill, U.S. Cellular prepares
valuations of each of the five reporting units. A discounted cash flow
approach is used to value each of the reporting units, using value
drivers and risks specific to each individual geographic region. The
cash flow estimates incorporate assumptions that market participants
would use in their estimates of fair value. Key assumptions made in
this process are the discount rate, estimated future cash flows,
projected capital expenditures and terminal value multiples.
U.S.
Cellular tests licenses for impairment at the level of reporting
referred to as a unit of accounting. For purposes of impairment testing
of licenses in 2007 and 2006, U.S. Cellular combined its FCC licenses
into eleven units of accounting pursuant to FASB Emerging Issues Task
Force Issue 02-7, Units of Accounting for Testing Impairment of Indefinite-Lived Intangible
Assets
("EITF 02-7"), and SFAS 142. Six of such units of accounting
represent geographic groupings of licenses that, because they are
currently undeveloped and not expected to generate cash flows from
operating activities in the foreseeable future, are considered separate
units of accounting for purposes of impairment testing.
For
purposes of impairment testing of licenses, U.S. Cellular prepares
valuations of each of the units of accounting which consist of
developed licenses using an excess earnings methodology. This excess
earnings methodology estimates the fair value of the intangible assets
(FCC license units of accounting) by measuring the future cash flows of
the license groups, reduced by charges for contributory assets such as
working capital, trademarks, existing subscribers, fixed assets,
assembled workforce and goodwill. For units of accounting that consist
of undeveloped licenses, U.S. Cellular prepares estimates of
fair value for each unit of accounting by reference to fair market values indicated by recent auctions and market transactions.
TDS
has recorded amounts as licenses and goodwill as a result of accounting
for U.S. Cellular's purchases of U.S. Cellular common shares
as step acquisitions using purchase accounting. TDS' ownership
percentage of U.S. Cellular increases upon such U.S. Cellular
share repurchases. The purchase price in excess of the fair value of
the net assets acquired is allocated principally to licenses and
goodwill. For impairment testing purposes, the additional TDS licenses
and goodwill amounts are allocated to the same units of accounting and
reporting units used by U.S. Cellular. In 2003,
U.S. Cellular's license and goodwill impairment tests did not
result in an impairment loss on a stand-alone basis. However, when the
license and goodwill amounts recorded at TDS, as a result of the step
acquisitions, were added to the U.S. Cellular licenses and
goodwill for impairment testing at the TDS consolidated level in 2003,
an impairment loss on licenses and goodwill was recorded. Consequently,
U.S. Cellular's license and goodwill balances reported on a
stand-alone basis do not match the TDS consolidated license and
goodwill balances for U.S. Cellular.
TDS Telecom
has recorded goodwill primarily as a result of the acquisition of
operating telephone companies. TDS Telecom has assigned goodwill
to its ILEC reporting unit, and for purposes of impairment testing,
valued this goodwill using a multiple of cash flow valuation technique.
The
annual impairment tests for investments in licenses and goodwill were
performed in the second quarter of 2007, 2006 and 2005. Such impairment
tests indicated that there was an impairment of licenses totaling
$2.1 million in 2007; the loss is included in Amortization and
accretion in the Consolidated Statements of Operations. There was no
impairment of licenses in 2006 and 2005, and no impairment of goodwill
in 2007, 2006 and 2005. In addition, as a result of the exchange of
licenses with Sprint Nextel, U.S. Cellular recognized a pre-tax
loss of $20.8 million during the fourth quarter of 2007.
There
was no impairment of goodwill assigned to TDS Telecom's ILEC operations in 2007, 2006 and 2005.
Property, Plant and Equipment
U.S. Cellular
and TDS Telecom each provide for depreciation using the
straight-line method over the estimated useful lives of the assets. TDS
depreciates its leasehold improvement assets associated with leased
properties over periods ranging from one to thirty years, which
approximates the shorter of the assets' economic lives or the specific
lease terms, as defined in SFAS No. 13, Accounting for Leases,
as amended. Annually, U.S. Cellular and TDS Telecom review
their property, plant and equipment lives to ensure that the estimated
useful lives are appropriate. The estimated useful lives of property,
plant and equipment are critical accounting estimates because changing
the lives of assets can result in larger or smaller charges for
depreciation expense. Factors used in determining useful lives include
technology changes, regulatory requirements, obsolescence and type of
use.
Prior
to the third quarter of 2007, TDS Telecom's ILEC operations
followed accounting for regulated enterprises prescribed by
SFAS 71. In the third quarter of 2007, management determined that
it was no longer appropriate to continue the application of
SFAS 71 for reporting its financial results. See
Note 5–Extraordinary Item–Discontinuance of the Application of
Statement of Financial Accounting Standards No. 71, Accounting for
the Effects of Certain Types of Regulation in the Notes to Consolidated
Financial Statements for additional details.
Renewals
and betterments of units of property are recorded as additions to
telephone plant in service. Repairs and renewals of minor units of
property are charged to plant operations expense. The original cost of
depreciable property retired is removed from plant in service and,
together with removal cost less any salvage realized, was charged to
accumulated depreciation, prior to the discontinuance of SFAS 71,
and to depreciation expense after the discontinuance of SFAS 71.
Prior to the discontinuance of SFAS 71, no gain or loss was
recognized on ordinary retirements of depreciable telephone property.
Costs
of developing new information systems are capitalized and amortized starting when each new system is placed in service.
U.S. Cellular
and TDS Telecom did not materially change the useful lives of
their property, plant and equipment in the years ended
December 31, 2007, 2006 and 2005.
In
2007, 2006 and 2005, (gain)/loss on asset disposals/exchanges included
charges of $34.1 million, $19.6 million and
$20.4 million, respectively, related to disposals of assets,
trade-ins of older assets for replacement assets and other retirements
of assets from service. In 2007, U.S. Cellular conducted a
physical inventory of its significant cell site and switching assets.
As a result, (gain)/loss on asset disposals/exchanges for 2007 included
a charge of $14.6 million to reflect the results of the physical
inventory and related valuation and reconciliation.
TDS
reviews long-lived assets for impairment if events or circumstances
indicate that the assets might be impaired. The tangible asset
impairment test is a two-step process. The first step compares the
carrying value of the assets with the estimated undiscounted cash flows
over the remaining asset life. If the carrying value of the asset is
greater than the undiscounted cash flows, then the second step of the
test is performed to measure the amount of impairment loss. The second
step compares the carrying value of the asset to its estimated fair
value. If the carrying value exceeds the estimated fair value (less
cost to sell), an impairment loss is recognized for the difference.
The
fair value of a tangible long-lived asset is the amount at which that
asset could be bought or sold in a current transaction between willing
parties. Therefore, quoted market prices in active markets are the best
evidence of fair value and should be used when available. If quoted
market prices are not available, the estimate of fair value is based on
the best information available, including prices for similar assets and
the use of other valuation techniques. A present value analysis of cash
flow scenarios is often the best available valuation technique with
which to estimate the fair value of a long-lived asset. The use of this
technique involves assumptions by management about factors that are
highly uncertain including future cash flows, the appropriate discount
rate, and other inputs. Different assumptions for these inputs or the
use of different valuation methodologies could create materially
different results.
Derivative Instruments
TDS
utilizes derivative financial instruments to reduce marketable equity
security market value risk. TDS does not hold or issue derivative
financial instruments for trading purposes. TDS recognizes all
derivatives as either assets or liabilities on the Consolidated Balance
Sheets and measures those instruments at fair value. Changes in fair
value of those instruments are reported in the Consolidated Statements
of Operations or classified as Accumulated other comprehensive income,
net of tax, in the Consolidated Balance Sheets depending on the use of
the derivative and whether it qualifies for hedge accounting. The
accounting for gains and losses associated with changes in the fair
value of the derivative and the effect on the consolidated financial
statements depend on the derivative's hedge designation and whether the
hedge is anticipated to be highly effective in achieving offsetting
changes in the fair value of the hedged item or cash flows of the asset
hedged.
The
VeriSign variable prepaid forward contract was designated as a fair
value hedge, where effectiveness of the hedge was assessed based upon
the intrinsic value of the underlying options. The intrinsic value of
the forward contract was defined as the difference between the
applicable option strike price and the market value of the contracted
shares on the balance sheet date. Changes in the intrinsic value of the
options are expected to be perfectly effective at offsetting changes in
the fair value of the hedged item. Changes in the fair value of the
options were recognized in the Statements of Operations along with the
changes in the fair value of the underlying marketable equity
securities.
TDS
originally designated the embedded collars within its Deutsche Telekom
and Vodafone variable prepaid forward contracts as cash flow hedges of
marketable equity securities. Accordingly, all changes in the fair
value of the embedded collars were recorded in other comprehensive
income, net of income taxes. Subsequently, upon contractual adjustments
to the collars in September 2002, the embedded collars no longer
qualified for the hedge accounting treatment and all changes in fair
value of the collars from that time are included in the Consolidated
Statements of Operations.
During
2007, the variable prepaid forward contracts and embedded collars
related to the VeriSign common shares, Vodafone ADRs and a portion of
the Deutsche Telekom ordinary shares matured and were settled. See
Note 10–Marketable Equity Securities in the Notes to Consolidated
Financial Statements, for details on the settlement of these forward
contracts and embedded collars.
The
accounting for the embedded collars as derivative instruments that do
not qualify for cash flow hedge accounting and fair value hedges is
expected to result in increased volatility in the results of
operations, as fluctuations in the market price of the underlying
Deutsche Telekom marketable equity securities will result in changes in
the fair value of the embedded collars being recorded in the
Consolidated Statements of Operations.
The
embedded collars are valued using the Black-Scholes valuation model.
The inputs in the model include the stock price, strike price (differs
for call options and put options), risk-free interest rate, volatility
of the underlying stock, dividend yield and the term of the contracts.
Different assumptions could create materially different results. A one
percent change in the risk free interest rate could change the fair
value of the embedded collars by approximately $4.2 million at
December 31, 2007. Changing the volatility index by one point
could change the fair value of the embedded collar by approximately
$0.3 million at December 31, 2007.
Asset Retirement Obligations
TDS accounts for asset retirement obligations under SFAS No. 143, Accounting for Asset Retirement
Obligations, and FASB Interpretation No. 47, Accounting for Conditional Asset Retirement Obligations,
("FIN 47") which require entities to record the fair value of a
liability for legal obligations associated with an asset retirement in
the period in which the obligations are incurred. At the time the
liability is incurred, TDS records a liability equal to the net present
value of the estimated cost of the asset retirement obligation and
increases the carrying amount of the related long-lived asset by an
equal amount. Over time, the liability is accreted to its present value
each period, and the capitalized cost is depreciated over the useful
life of the related asset. Upon settlement of the obligations, any
differences between the cost to retire an asset and the recorded
liability (including accretion of discount) is recognized in the
Consolidated Statements of Operations as a gain or loss.
See
Note 13–Asset Retirement Obligations in the Notes to Consolidated
Financial Statements in the Notes to Consolidated Financial Statements,
for details on estimates that impact asset retirement obligations.
The
calculation of the asset retirement obligation is a critical accounting
estimate for TDS because changing the factors used in calculating the
obligation could result in larger or smaller estimated obligations that
could have a significant impact on TDS' results of operations and
financial condition. Such factors may include probabilities or
likelihood of remediation, cost estimates, lease renewals, salvage
values, and the estimated remediation dates. Actual results may differ
materially from estimates under different assumptions or conditions.
Income Taxes
The
accounting for income taxes, the amounts of income tax assets and
liabilities and the related income tax provision, and the amount of
unrecognized tax benefits are critical accounting estimates because
such amounts are significant to TDS' financial condition and results of
operations.
The
preparation of the consolidated financial statements requires TDS to
calculate a provision for income taxes. This process involves
estimating the actual current income tax liability together with
assessing temporary differences resulting from the different treatment
of items for tax purposes, as well as estimating the impact of
potential adjustments to filed tax returns. These temporary differences
result in deferred income tax assets and liabilities, which are
included in the Consolidated Balance Sheets. TDS must then assess the
likelihood that deferred income tax assets will be realized based on
future taxable income
and to the extent TDS believes that realization is not likely,
establish a valuation allowance. Management's judgment is required in
determining the provision for income taxes, deferred income tax assets
and liabilities and any valuation allowance that is established for
deferred income tax assets.
Effective
January 1, 2007, TDS adopted FASB Interpretation No. 48, Accounting for Uncertainty in Income Taxes
("FIN 48"). FIN 48 addressed the determination of how tax
benefits claimed or expected to be claimed on a tax return should be
recorded in the financial statements. Under FIN 48, TDS must
recognize the tax benefit from an uncertain tax position only if it is
more likely than not that the tax position will be sustained on
examination by the taxing authorities, based on the technical merits of
the position. The tax benefits recognized in the financial statements
from such a position are measured based on the largest benefit that has
a greater than fifty percent likelihood of being realized upon ultimate
resolution.
See
Note 4–Income Taxes in the Notes to Consolidated Financial
Statements for details regarding TDS' income tax provision, deferred
income taxes and liabilities, valuation allowances and unrecognized tax
benefits, including information regarding estimates that impact income
taxes.
Allowance for Doubtful Accounts
The
allowance for doubtful accounts is the best estimate of the amount of
probable credit losses related to existing accounts receivable. The
allowance is estimated based on historical experience and other factors
that could affect collectibility. Accounts receivable balances are
reviewed on either an aggregate or individual basis for collectibility
depending on the type of receivable. When it is probable that an
account balance will not be collected, the account balance is charged
against the allowance for doubtful accounts. TDS does not have any
off-balance sheet credit exposure related to its customers. Recent
economic events have caused the consumer credit market to tighten for
certain consumers. This may cause TDS' bad debt expense to increase in
future periods. TDS will continue to monitor its accounts receivable
balances and related allowance for doubtful accounts on an ongoing
basis to assess whether it has adequately provided for potentially
uncollectible amounts.
See
Note 1–Summary of Significant Accounting Policies in the Notes to
the Consolidated Financial Statements for additional information
regarding TDS' allowance for doubtful accounts.
Stock-based Compensation
As
described in more detail in Note 22–Stock Based Compensation in
the Notes to the Consolidated Financial Statements, TDS has established
long-term incentive plans and employee stock purchase plans, which are
stock-based compensation plans. Prior to January 1, 2006, TDS
accounted for share-based payments in accordance with Accounting
Principles Board ("APB"), No. 25 Accounting for Stock Issued to Employees ("APB 25") and related interpretations as
allowed by SFAS No. 123 Accounting for Stock-Based Compensation
("SFAS 123"). Accordingly, prior to 2006, compensation cost for
share-based payments was measured using the intrinsic value method as
prescribed by APB 25. Under the intrinsic value method,
compensation cost is measured as the amount by which the market value
of the underlying equity instrument on the grant date exceeds the
exercise price. Effective January 1, 2006, TDS adopted the fair
value recognition provisions of SFAS No. 123(R), using the
modified prospective transition method. Under the modified prospective
transition method, compensation cost recognized during the years ended
December 31, 2007 and 2006 includes: (a) compensation cost
for all share-based payments granted prior to but not yet vested as of
January 1, 2006, based on the grant date fair value estimated in
accordance with the original provisions of SFAS 123, and
(b) compensation cost for all share-based payments granted
subsequent to January 1, 2006, based on the grant-date fair value
estimated in accordance with the provisions of SFAS 123(R).
Upon
adoption of SFAS 123(R), TDS and U.S. Cellular elected to
value share-based payment transactions using a Black-Scholes valuation
model. This model requires assumptions regarding a number of complex
and subjective variables. The variables include TDS' and
U.S. Cellular's expected stock
price volatility over the term of the awards, expected forfeitures,
time of exercise, risk-free interest rate and expected dividends.
Different assumptions could create different results.
TDS
used the assumptions shown in the table below in valuing stock options granted in 2007, 2006 and 2005:
|
|
2007 |
|
2006 |
|
2005 |
| Expected Life |
|
4.0 Years |
|
4.9 Years |
|
4.9 Years |
| Expected Annual Volatility Rate |
|
19.5% |
|
25.9% |
|
30.8% |
| Dividend Yield |
|
0.7% |
|
0.7% - 1.0% |
|
0.9% |
| Risk-free Interest Rate |
|
4.7% |
|
3.9% - 4.8% |
|
3.8% |
| Estimated Annual Forfeiture Rate |
|
1% |
|
0.6% |
|
0.7% |
U.S. Cellular
used the assumptions shown in the table below in valuing the stock
options granted in 2007, 2006 and 2005:
|
|
2007 |
|
2006 |
|
2005 |
| Expected Life |
|
3.1 Years |
|
3.0 Years |
|
3.0 Years |
| Expected Volatility |
|
22.5% - 25.7% |
|
23.5% - 25.2% |
|
36.5% |
| Dividend Yield |
|
0% |
|
0% |
|
0% |
| Risk-free Interest Rate |
|
3.3% - 4.8% |
|
4.5% - 4.7% |
|
3.9% |
| Estimated Annual Forfeiture Rate |
|
9.6% |
|
4.4% |
|
4.3% |
Both
TDS and U.S. Cellular estimate the expected life of option awards
based on historical experience. Expected volatility is estimated using
historical volatility calculated over the most recent period equal to
the expected term of the option. Risk-free interest rate is the rate of
return of a zero-coupon treasury bond that matures over approximately
the same time period as the expected term of the option awards. Because
U.S. Cellular has never paid a dividend and has expressed its
intention to retain all future earnings in the business, the expected
dividend yield is estimated at 0%.
Under
the provisions of SFAS 123(R), stock-based compensation cost
recognized during the period is based on the portion of the share-based
payment awards that are expected to ultimately vest. The estimated
forfeiture rates used by U.S. Cellular are based primarily on
historical experience.
Total
compensation cost for stock options granted by TDS and
U.S. Cellular in 2007 was estimated to be $18.1 million; the
amount charged to compensation expense was $15.3 million. The
table below illustrates the impact of a 10% change in the assumptions
that have the most significant impact on valuation of option awards
granted by TDS in 2007.
(Dollars in thousands)
|
|
Increase (Decrease) in
2007 Expense |
|
Increase (Decrease) in Expense
Over Vesting Period of Options |
|
Assumption:
|
|
10% Increase |
|
10% Decrease |
|
10% Increase |
|
10% Decrease |
|
| Expected Life |
|
$ |
672 |
|
$ |
(716 |
) |
$ |
672 |
|
$ |
(716 |
) |
| Expected Volatility |
|
$ |
655 |
|
$ |
(646 |
) |
$ |
655 |
|
$ |
(646 |
) |
| Risk-free Interest Rate |
|
$ |
471 |
|
$ |
(471 |
) |
$ |
471 |
|
$ |
(471 |
) |
The
table below illustrates the impact of a 10% change in the assumptions
that have the most significant impact on valuation of option awards
granted by U.S. Cellular in 2007.
(Dollars in thousands)
|
|
Increase (Decrease) in
2007 Expense |
|
Increase (Decrease) in Expense
Over Vesting Period of Options |
|
Assumption:
|
|
10% Increase |
|
10% Decrease |
|
10% Increase |
|
10% Decrease |
|
| Expected Life |
|
$ |
179 |
|
$ |
(186 |
) |
$ |
447 |
|
$ |
(465 |
) |
| Expected Volatility |
|
$ |
190 |
|
$ |
(190 |
) |
$ |
474 |
|
$ |
(474 |
) |
| Risk-free Interest Rate |
|
$ |
91 |
|
$ |
(88 |
) |
$ |
228 |
|
$ |
(219 |
) |
Contingencies, Indemnities and Commitments
Contingent
obligations not related to income taxes, including indemnities,
litigation and other possible commitments are accounted for in
accordance with SFAS No. 5, Accounting for Contingencies
("SFAS 5"), which requires that an estimated loss be recorded if
it is probable that an asset has been impaired or a liability has been
incurred at the date of the financial statements and the amount of the
loss can be reasonably estimated. Accordingly, those contingencies that
are deemed to be probable and where the amount of the loss is
reasonably estimable are accrued in the financial statements. If only a
range of loss can be determined, the best estimate within that range is
accrued; if none of the estimates within that range is better than
another, the low end of the range is accrued. Disclosure of a
contingency is required if there is at least a reasonable possibility
that a loss has been incurred, even if the amount is not estimable. The
assessment of contingencies is a highly subjective process that
requires judgments about future events. Contingencies are reviewed at
least quarterly to determine the adequacy of accruals and related
financial statement disclosures. The ultimate outcomes of contingencies
could differ materially from amounts accrued in the financial
statements.
Certain Relationships and Related Transactions The following persons are partners of Sidley Austin LLP, the principal
law firm of TDS and its subsidiaries: Walter C.D. Carlson, a
trustee and beneficiary of a voting trust that controls TDS, the
non-executive Chairman of the Board and member of the board of
directors of TDS and a director of U.S. Cellular, a subsidiary of
TDS; William S. DeCarlo, the General Counsel of TDS and an Assistant
Secretary of TDS and certain subsidiaries of TDS; and Stephen P.
Fitzell, the General Counsel of U.S. Cellular and
TDS Telecommunications Corporation and an Assistant Secretary of
certain subsidiaries of TDS. Walter C.D. Carlson does not provide legal
services to TDS or its subsidiaries. TDS, U.S. Cellular and their
subsidiaries incurred legal costs from Sidley Austin LLP of
$11.2 million in 2007, $12.0 million in 2006 and
$7.8 million in 2005.
The
Audit Committee of the Board of Directors is responsible for the review
and oversight of all related party transactions, as such term is
defined by the rules of the American Stock Exchange.
Private Securities Litigation Reform Act of 1995 Safe Harbor Cautionary Statement This Management's Discussion and Analysis of Financial Condition and Results
of Operations and other sections of this Annual Report contain
statements that are not based on historical fact, including the words
"believes," "anticipates," "intends," "expects" and similar words.
These statements constitute "forward-looking statements" within the
meaning of the Private Securities Litigation Reform Act of 1995. Such
forward-looking statements involve known and unknown risks,
uncertainties and other factors that may cause the actual results,
events or developments to be significantly different from any future
results, events or developments expressed or implied by such
forward-looking statements. Such factors include, but are not limited
to, the following risks:
- Intense
competition in the markets in which TDS operates could adversely affect
TDS' revenues or increase its costs to compete.
- A
failure by TDS' service offerings to meet customer expectations could
limit TDS' ability to attract and retain customers and could have an
adverse effect on TDS' operations.
- TDS'
system infrastructure may not be capable of supporting changes in
technologies and services expected by customers, which could result in
lost customers and revenues.
- An
inability to obtain or maintain roaming arrangements with other
carriers on terms that are acceptable to TDS could have an adverse
effect on TDS' business, financial condition or results of operations.
Such agreements cover traditional voice services as well as data
services, which are an area of strong growth for TDS and other
carriers. TDS' rate of adoption of new technologies, such as those
enabling high-speed data services, could affect its ability to enter
into or maintain roaming agreements with other carriers.
- Changes
in access to content for data or video services or access to new
handsets being developed by vendors, or an inability to manage its
supply chain or inventory successfully, could have an adverse effect on
TDS' business, financial condition or results of operations.
- A failure by TDS to acquire adequate radio spectrum could have an adverse effect on TDS' business and operations.
- TDS
is currently participating and, to the extent conducted by the FCC,
likely to participate in FCC auctions of additional spectrum in the
future and, during certain periods, will be subject to the FCC's
anti-collusion rules, which could have an adverse effect on TDS.
- An
inability to attract and/or retain management, technical, sales and
other personnel could have an adverse effect on TDS' business,
financial condition or results of operations.
- TDS'
assets are concentrated in the U.S. telecommunications industry. As a
result, its results of operations may fluctuate based on factors
related entirely to conditions in this industry.
- Consolidation
in the telecommunications industry could adversely affect TDS' revenues
and increase its costs of doing business.
- Changes
in general economic and business conditions, both nationally and in the
markets in which TDS operates, could have an adverse effect on TDS'
business, financial condition or results of operations.
- Changes
in various business factors could have an adverse effect on TDS'
business, financial condition or results of operations. These business
factors may include but are not limited to demand, pricing, growth,
average revenue per unit, penetration, churn, expenses, customer
acquisition and retention costs, roaming rates, minutes of use, and mix
and costs of products and services.
- Advances
or changes in telecommunications technology, such as Voice over
Internet Protocol, WiMAX or LTE (Long-Term Evolution), could render
certain technologies used by TDS obsolete, could reduce TDS' revenues
or could increase its costs of doing business.
- Changes
in TDS' enterprise value, changes in the supply or demand of the market
for wireless licenses or telephone company franchises, adverse
developments in the business or the industry in which TDS is involved
and/or other factors could require TDS to recognize impairments in the
carrying value of TDS' license costs, goodwill and/or physical assets.
- Costs,
integration problems or other factors associated with
acquisitions/divestitures of properties or licenses and/or expansion of
TDS' business could have an adverse effect on TDS' business, financial
condition or results of operations.
- A
significant portion of TDS' wireless revenues is derived from customers
who buy services through independent agents and dealers who market TDS'
services on a commission basis. If TDS' relationships with these agents
and dealers are seriously harmed, its wireless revenues could be
adversely affected.
- TDS'
investments in technologies which are unproven or for which success has
not yet been demonstrated may not produce the benefits that TDS
expects.
- A
failure by TDS to complete significant network construction and system
implementation as part of its plans to improve the quality, coverage,
capabilities and capacity of its network could have an adverse effect
on its operations.
- Financial
difficulties of TDS' key suppliers or vendors, or termination or
impairment of TDS' relationship with such suppliers or vendors could
result in a delay or termination of TDS' receipt of equipment, content
or services which could adversely affect TDS' business and results of
operations.
- TDS
has significant investments in entities that it does not control.
Losses in the value of such investments could have an adverse effect on
TDS' results of operations or financial condition.
- War,
conflicts, hostilities and/or terrorist attacks or equipment failure,
power outages, natural disasters or breaches of network or information
technology security could have an adverse effect on TDS' business,
financial condition or results of operations.
- The
market prices of TDS' Common Shares and Special Common Shares are
subject to fluctuations due to a variety of factors such as general
economic conditions; wireless and telecommunications industry
conditions; fluctuations in TDS' quarterly customer activations, churn
rate, revenues, results of operations or cash flows; variations between
TDS' actual financial and operating results and those expected by
analysts and investors; and announcements by TDS' competitors.
- Changes
in guidance or interpretations of accounting requirements, changes in
industry practice, identification of errors or changes in management
assumptions could require amendments to or restatements of financial
information or disclosures included in this or prior filings with the
SEC.
- Restatements
of financial statements by TDS and related matters, including resulting
delays in filing periodic reports with the SEC, could have an adverse
effect on TDS' credit rating, liquidity, financing arrangements,
capital resources and ability to access the capital markets, including
pursuant to shelf registration statements; could adversely affect TDS'
listing arrangements on the American Stock Exchange and/or New York
Stock Exchange; and/or could have other negative consequences, any of
which could have an adverse effect on the trading prices of TDS'
publicly traded equity and/or debt and/or on TDS' business, financial
condition or results of operations.
- The
pending SEC investigation regarding the restatement of TDS' financial
statements could result in substantial expenses, and could result in
monetary or other penalties.
- Changes
in facts or circumstances, including new or additional information that
affects the calculation of potential liabilities for contingent
obligations under guarantees, indemnities or otherwise, could require
TDS to record charges in excess of amounts accrued in the financial
statements, if any, which could have an adverse effect on TDS'
financial condition or results of operations.
- A
failure to successfully remediate the existing material weakness in
internal control over financial reporting in a timely manner or the
identification of additional material weaknesses in the effectiveness
of internal control over financial reporting could result in inaccurate
financial statements or other disclosures or fail to prevent fraud,
which could have an adverse effect on TDS' business, financial
condition or results of operations.
- Early
redemptions of debt or repurchases of debt, issuances of debt, changes
in prepaid forward contracts, changes in operating leases, changes in
purchase obligations or other factors or developments could cause the
amounts reported under Contractual Obligations in TDS' Management's
Discussion and Analysis of Financial Condition and Results of
Operations to be different from the amounts actually incurred.
- An
increase of TDS' debt in the future could subject TDS to various
restrictions and higher interest costs and decrease its cash flows and
earnings.
- Uncertainty
of access to capital for telecommunications companies, deterioration in
the capital markets, other changes in market conditions, changes in
TDS' credit ratings or other factors could limit or restrict the
availability of financing on terms and prices acceptable to TDS, which
could require TDS to reduce its construction, development and
acquisition programs.
- Changes
in the regulatory environment or a failure by TDS to timely or fully
comply with any regulatory requirements could adversely affect TDS'
financial condition, results of operations or ability to do business.
- Changes
in income tax rates, laws, regulations or rulings, or federal or state
tax assessments could have an adverse effect on TDS' financial
condition or results of operations.
- Settlements,
judgments, restraints on its current or future manner of doing business
and/or legal costs resulting from pending and future litigation could
have an adverse effect on TDS' financial condition, results of
operations or ability to do business.
- The
possible development of adverse precedent in litigation or conclusions
in professional studies to the effect that radio frequency emissions
from handsets, wireless data devices and/or cell sites cause harmful
health consequences, including cancer or tumors, or may interfere with
various electronic medical devices such as pacemakers, could have an
adverse effect on TDS' wireless business, financial condition or
results of operations.
- Certain
matters, such as control by the TDS Voting Trust and provisions in the
TDS Restated Certificate of Incorporation, may serve to discourage or
make more difficult a change in control of TDS.
- Any
of the foregoing events or other events could cause revenues, customer
additions, operating income, capital expenditures and/or any other
financial or statistical information to vary from TDS' forward looking
estimates by a material amount.
You
are referred to a further discussion of these risks as set forth under
"Risk Factors" in TDS' Annual Report on Form 10-K for the year
ended December 31, 2007. TDS undertakes no obligation to update
publicly any forward-looking statements whether as a result of new
information, future events or otherwise. Readers should evaluate any
statements in light of these important factors.
Long-Term Debt
As
of December 31, 2007, TDS is subject to risks due to fluctuations
in interest rates. The majority of TDS' debt is in the form of
long-term, fixed-rate notes with original maturities ranging up to
40 years. Accordingly, fluctuations in interest rates can lead to
significant fluctuations in the fair value of such instruments. As of
December 31, 2007, TDS had not entered into any financial
derivatives to reduce its exposure to interest rate risks.
The
following table presents the scheduled principal payments on long-tem
debt and forward contracts and the related weighted-average interest
rates by maturity dates at December 31, 2007:
|
|
Principal Payments Due by Period |
|
(Dollars in millions)
|
|
Long-Term
Debt Obligations(1) |
|
Weighted-Avg.
Interest Rates
on Long-Term
Debt Obligations(2) |
|
Forward
Contracts(3) |
|
Weighted-Avg.
Interest Rates on
Forward Contracts(4) |
|
| 2008 |
|
$ |
3.9 |
|
5.5 |
% |
$ |
1,015.4 |
|
4.97 |
% |
| 2009 |
|
|
15.1 |
|
7.9 |
% |
|
– |
|
N/A |
|
| 2010 |
|
|
4.5 |
|
5.7 |
% |
|
– |
|
N/A |
|
| 2011 |
|
|
0.8 |
|
3.9 |
% |
|
– |
|
N/A |
|
| 2012 |
|
|
0.4 |
|
3.2 |
% |
|
– |
|
N/A |
|
| After 5 Years |
|
|
1,611.4 |
|
7.3 |
% |
|
– |
|
N/A |
|
| |
|
|
|
|
|
|
|
|
|
| Total |
|
$ |
1,636.1 |
|
7.3 |
% |
$ |
1,015.4 |
|
4.97 |
% |
| |
|
|
|
|
|
|
|
|
|
At
December 31, 2007 and 2006, the estimated fair value of long-term
debt obligations was $1,415.0 million and $1,639.1 million,
respectively, and the average interest rate on this debt was 7.3% and
7.3%, respectively. The fair value of long-term debt was estimated
using market prices for TDS' 7.6% Series A Notes, 6.625% senior
notes, and U.S. Cellular's 8.75% senior notes, 7.5% senior notes,
6.7% senior notes, and discounted cash flow analysis for the remaining
debt.
At
December 31, 2007 and 2006, the estimated fair value of the
variable prepaid forward contracts was $1,006.6 million and
$1,718.1 million, respectively, and the average interest rate on
this debt was 4.97% and 5.5%, respectively. The fair value of variable
rate forward contracts, aggregating $577.3 million at
December 31, 2007, approximates the carrying value due to the
frequent repricing of these instruments. These contracts require
quarterly interest payments at the LIBOR rate plus 50 basis points (the
three-month LIBOR rate was 4.7% at December 31, 2007). The fair
value of the fixed rate forward contracts, aggregating
$429.3 million at December 31, 2007, was estimated based upon
a discounted cash flow analysis. These contracts are structured as zero
coupon obligations with a weighted average effective interest rate of
4.4% per year.
Marketable Equity Securities and Derivatives
TDS
holds available-for-sale marketable equity securities, the majority of
which were the result of sales or trades of non-strategic assets. The
market value of these investments aggregated $1,917.9 million at
December 31, 2007, and $2,790.6 million at December 31,
2006. As of December 31, 2007, the unrealized holding gain, net of
tax, included in accumulated other comprehensive income totaled
$665.4 million. This amount was $750.0 million at
December 31, 2006.
TDS
and its subsidiaries own 719,396 shares of Rural Cellular
Corporation ("RCCC"). On July 30, 2007, RCCC announced that
Verizon Wireless had agreed to purchase the outstanding shares of RCCC
for $45 per share in cash. The acquisition is expected to close in the
first half of 2008. If the transaction closes, TDS will receive
approximately $32.4 million in cash, recognize a
$31.7 million pre-tax gain and cease to own any interest in RCCC.
TDS
has a number of variable prepaid forward contracts ("forward
contracts") with counterparties related to the Deutsche Telekom
ordinary shares that are held by TDS. The economic hedge risk
management objective of the forward contracts is to hedge the value of
the marketable equity securities from losses due to decreases in the
market prices of the securities ("downside limit") while retaining a
share of gains from increases in the market prices of such securities
("upside potential"). The downside limit is hedged at or above the cost
basis of the securities.
Under
the terms of the forward contracts, TDS will continue to own the
Deutsche Telekom ordinary shares and will receive dividends paid on
such contracted shares, if any. The forward contracts mature from
January 2008 to September 2008 and, at TDS' option, may be settled in
shares of Deutsche Telekom or in cash, pursuant to formulas that
"collar" the price of the shares. The collars effectively limit
downside risk and upside potential on the contracted shares. The
collars are typically contractually adjusted for any changes in
dividends on the underlying shares. If the dividend increases, the
collar's upside potential is typically reduced. If the dividend
decreases, the collar's upside potential is typically increased. If TDS
elects to settle in shares, TDS will be required to deliver the number
of shares of Deutsche Telekom determined pursuant to the formula. If
shares are delivered in the settlement of the forward contract, TDS
would incur a current tax liability at the time of delivery based on
the difference between the tax basis of the Deutsche Telekom ordinary
shares delivered and the net amount realized under the forward contract
through maturity. If TDS elects to settle in cash, TDS will be required
to pay an amount in cash equal to the fair market value of the number
of shares determined pursuant to the formula.
TDS
elected to deliver a substantial majority of the Deutsche Telekom
ordinary shares reflected in current assets as of December 31,
2006, in settlement of the forward contracts relating to such Deutsche
Telekom ordinary shares, which matured in July through September 2007,
and disposed of the remaining Deutsche Telekom ordinary shares related
to such forward contracts. After these forward contracts were settled
in July through September 2007, TDS now owns 85,969,689 Deutsche
Telekom ordinary shares. TDS recorded a pre-tax gain of
$248.9 million in 2007 on the settlement of such forward contracts
and the disposition of such remaining shares.
The
forward contracts related to TDS' subsidiaries' Vodafone ADRs matured
in May and October 2007. TDS' subsidiaries elected to deliver a
substantial majority of the Vodafone ADRs in settlement of the forward
contracts, and disposed of all remaining Vodafone ADRs in connection
therewith. TDS recorded a pre-tax gain of $171.6 million in 2007
on the settlement of such forward contracts and the disposition of such
remaining ADRs. As a result of the settlement of these forward
contracts in May and October 2007, TDS' subsidiaries no longer own any
Vodafone ADRs and no longer have any liability or other obligations
under the related forward contracts.
The
forward contracts related to TDS' VeriSign Common Shares matured in May
2007. TDS elected to deliver a substantial majority of the VeriSign
Common Shares in settlement of the forward contracts, and disposed of
all remaining VeriSign Common Shares in connection therewith. TDS
recorded a pre-tax gain
of $6.2 million in 2007 on the settlement of such forward
contracts and the disposition of such remaining shares. As a result of
the settlement of these forward contracts in May 2007, TDS no longer
owns any VeriSign Common Shares and no longer has any liability or
other obligations under the related forward contracts.
Deferred
income taxes have been provided for the difference between the fair
value basis and the income tax basis of the marketable equity
securities and derivatives. Deferred tax assets and liabilities at
December 31, 2007 and 2006 are summarized below.
|
|
2007 |
|
2006 |
(Dollars in thousands)
|
| |
Current |
|
NonCurrent |
|
Total |
|
Current |
|
NonCurrent |
|
Total |
| Deferred Tax Assets |
|
|
|
|
|
|
|
|
|
|
|
|
|
|
|
|
|
|
| |
Derivative liability |
|
$ |
264.9 |
|
$ |
– |
|
$ |
264.9 |
|
$ |
143.6 |
|
$ |
159.0 |
|
$ |
302.6 |
| Deferred Tax Liabilities |
|
|
|
|
|
|
|
|
|
|
|
|
|
|
|
|
|
|
| |
Marketable equity securities |
|
$ |
625.4 |
|
$ |
– |
|
$ |
625.4 |
|
$ |
395.9 |
|
$ |
547.6 |
|
$ |
943.5 |
The
following table summarizes certain facts surrounding the contracted
securities as of December 31, 2007.
|
|
|
|
Collar(1) |
|
|
|
Security
|
|
Shares |
|
Downside Limit
(Floor) |
|
Upside Potential
(Ceiling) |
|
Loan Amount(2)
(000s) |
|
| Deutsche Telekom |
|
85,969,689 |
|
$10.89 - $12.41 |
|
$12.40 - $14.99 |
|
$ |
1,015,364 |
|
| |
Unamortized debt discount |
|
|
|
|
|
|
|
|
(9,852 |
) |
| |
|
|
|
|
|
|
|
$ |
1,005,512 |
|
The
following analysis presents the hypothetical change in the fair value
of marketable equity securities and derivative instruments at
December 31, 2007 and December 31, 2006, using the Black-Scholes
model, assuming hypothetical price fluctuations of plus and minus 10%,
20% and 30%. The table presents hypothetical information as required by
SEC rules.
(Asset/(Liability) dollars in millions)
|
|
|
|
|
|
|
|
|
December 31, 2007
|
|
Valuation of investments assuming indicated increase |
|
|
|
Fair Value |
|
+10% |
|
+20% |
|
+30% |
|
| Marketable Equity Securities |
|
$ |
1,917.9 |
|
$ |
2,109.7 |
|
$ |
2,301.5 |
|
$ |
2,493.3 |
|
| Derivative Instruments(1) |
|
$ |
(711.7 |
) |
$ |
(894.8 |
) |
$ |
(1,078.5 |
) |
$ |
(1,262.5 |
) |
December 31, 2007
|
|
Valuation of investments assuming indicated decrease |
|
|
|
Fair Value |
|
-10% |
|
-20% |
|
-30% |
|
| Marketable Equity Securities |
|
$ |
1,917.9 |
|
$ |
1,726.1 |
|
$ |
1,534.3 |
|
$ |
1,342.5 |
|
| Derivative Instruments(1) |
|
$ |
(711.7 |
) |
$ |
(530.3 |
) |
$ |
(353.8 |
) |
$ |
(189.4 |
) |
December 31, 2006
|
|
Valuation of investments assuming indicated increase |
|
|
|
Fair Value |
|
+10% |
|
+20% |
|
+30% |
|
| Marketable Equity Securities |
|
$ |
2,790.6 |
|
$ |
3,069.7 |
|
$ |
3,348.7 |
|
$ |
3,627.8 |
|
| Derivative Instruments(1) |
|
$ |
(753.7 |
) |
$ |
(1,015.7 |
) |
$ |
(1,289.6 |
) |
$ |
(1,563.9 |
) |
December 31, 2006
|
|
Valuation of investments assuming indicated decrease |
|
|
|
Fair Value |
|
-10% |
|
-20% |
|
-30% |
|
| Marketable Equity Securities |
|
$ |
2,790.6 |
|
$ |
2,511.5 |
|
$ |
2,232.5 |
|
$ |
1,953.4 |
|
| Derivative Instruments(1) |
|
$ |
(753.7 |
) |
$ |
(499.7 |
) |
$ |
(264.7 |
) |
$ |
(51.9 |
) |
Telephone and Data Systems, Inc. and Subsidiaries - Consolidated Statements of Operations
Year Ended December 31,
|
|
2007 |
|
2006 |
|
2005 |
|
| (Dollars and shares in thousands, except per share amounts) |
|
|
|
| Operating Revenues |
|
$ |
4,828,984 |
|
$ |
4,364,518 |
|
$ |
3,952,978 |
|
| Operating Expenses |
|
|
|
|
|
|
|
|
|
|
| |
Cost of services and products (exclusive of depreciation, amortization and |
|
|
|
|
|
|
|
|
|
|
| |
|
accretion shown separately below) |
|
|
1,696,459 |
|
|
1,541,541 |
|
|
1,433,723 |
|
| |
Selling, general and administrative expense |
|
|
1,797,551 |
|
|
1,672,722 |
|
|
1,502,124 |
|
| |
Depreciation, amortization and accretion expense |
|
|
752,219 |
|
|
717,891 |
|
|
658,464 |
|
| |
(Gain) loss on asset disposals/exchanges |
|
|
54,857 |
|
|
19,587 |
|
|
(22,031 |
) |
| |
|
Total Operating Expenses |
|
|
4,301,086 |
|
|
3,951,741 |
|
|
3,572,280 |
|
| Operating Income |
|
|
527,898 |
|
|
412,777 |
|
|
380,698 |
|
| Investment and Other Income (Expense) |
|
|
|
|
|
|
|
|
|
|
| |
Equity in earnings of unconsolidated entities |
|
|
91,831 |
|
|
95,170 |
|
|
68,039 |
|
| |
Interest and dividend income |
|
|
199,435 |
|
|
194,644 |
|
|
156,482 |
|
| |
Fair value adjustment of derivative instruments |
|
|
(351,570 |
) |
|
(299,525 |
) |
|
733,728 |
|
| |
Gain (loss) on investments |
|
|
432,993 |
|
|
161,846 |
|
|
(6,254 |
) |
| |
Interest expense |
|
|
(208,736 |
) |
|
(234,543 |
) |
|
(216,021 |
) |
| |
Other, net |
|
|
(6,401 |
) |
|
(7,031 |
) |
|
(9,537 |
) |
| |
|
Total Investment and Other Income (Expense) |
|
|
157,552 |
|
|
(89,439 |
) |
|
726,437 |
|
Income From Continuing Operations Before Income Taxes and Minority Interest |
|
|
685,450 |
|
|
323,338 |
|
|
1,107,135 |
|
| Income tax expense |
|
|
269,054 |
|
|
116,459 |
|
|
423,185 |
|
| Income From Continuing Operations Before Minority Interest |
|
|
416,396 |
|
|
206,879 |
|
|
683,950 |
|
| Minority share of income |
|
|
(73,111 |
) |
|
(45,120 |
) |
|
(37,207 |
) |
| Income From Continuing Operations |
|
|
343,285 |
|
|
161,759 |
|
|
646,743 |
|
| Discontinued operations, net of tax |
|
|
– |
|
|
– |
|
|
997 |
|
| Income Before Extraordinary Item |
|
|
343,285 |
|
|
161,759 |
|
|
647,740 |
|
| Extraordinary item, net of tax |
|
|
42,827 |
|
|
– |
|
|
– |
|
| Net Income |
|
|
386,112 |
|
|
161,759 |
|
|
647,740 |
|
| Preferred dividend requirement |
|
|
(52 |
) |
|
(165 |
) |
|
(202 |
) |
| Net Income Available to Common |
|
$ |
386,060 |
|
$ |
161,594 |
|
$ |
647,538 |
|
Basic Weighted Average Shares Outstanding |
|
|
117,624 |
|
|
115,904 |
|
|
115,296 |
|
| Basic Earnings per Share< /td>
| |
|
|
|
|
|
|
|
|
|
| |
Income from Continuing Operations |
|
$ |
2.92 |
|
$ |
1.39 |
|
$ |
5.61 |
|
| |
Discontinued Operations |
|
|
– |
|
|
– |
|
|
0.01 |
|
| |
Extraordinary item |
|
|
0.36 |
|
|
– |
|
|
– |
|
| |
Net Income Available to Common |
|
$ |
3.28 |
|
$ |
1.39 |
|
$ |
5.62 |
|
Diluted Weighted Average Shares Outstanding |
|
|
119,126 |
|
|
116,844 |
|
|
116,081 |
|
| Diluted Earnings per Share |
|
|
|
|
|
|
|
|
|
|
| |
Income from Continuing Operations |
|
$ |
2.86 |
|
$ |
1.37 |
|
$ |
5.56 |
|
| |
Discontinued Operations |
|
|
– |
|
|
– |
|
|
0.01 |
|
| |
Extraordinary item |
|
|
0.36 |
|
|
– |
|
|
– |
|
| |
Net Income Available to Common |
|
$ |
3.22 |
|
$ |
1.37 |
|
|
5.57 |
|
Dividends per Share |
|
$ |
0.39 |
|
$ |
0.37 |
|
$ |
0.35 |
|
The accompanying notes are an integral part of these consolidated financial statements.
Telephone and Data Systems, Inc. and Subsidiaries - Consolidated Statements of Cash Flows
Year Ended December 31,
|
|
2007 |
|
2006 |
|
2005 |
|
(Dollars in thousands)
|
|
|
|
| Cash Flows from Operating Activities |
|
|
|
|
|
|
|
|
|
|
| |
Net income |
|
$ |
386,112 |
|
$ |
161,759 |
|
$ |
647,740 |
|
| |
Add (deduct) adjustments to reconcile net income to net cash from operating activities |
|
|
|
|
|
|
|
|
|
|
| |
|
Depreciation, amortization and accretion |
|
|
752,219 |
|
|
717,891 |
|
|
658,464 |
|
| |
|
Bad debts expense |
|
|
74,988 |
|
|
70,366 |
|
|
46,427 |
|
| |
|
Stock-based compensation expense |
|
|
31,891 |
|
|
43,406 |
|
|
8,069 |
|
| |
|
Deferred income taxes, net |
|
|
(283,047 |
) |
|
(195,000 |
) |
|
264,948 |
|
| |
|
Fair value adjustment of derivative instruments |
|
|
351,570 |
|
|
299,525 |
|
|
(733,728 |
) |
| |
|
Equity in earnings of unconsolidated entities |
|
|
(91,831 |
) |
|
(95,170 |
) |
|
(68,039 |
) |
| |
|
Distributions from unconsolidated entities |
|
|
87,404 |
|
|
78,248 |
|
|
52,624 |
|
| |
|
Minority share of income |
|
|
73,111 |
|
|
45,120 |
|
|
37,207 |
|
| |
|
(Gain) loss on asset disposals/exchanges |
|
|
54,857 |
|
|
19,587 |
|
|
(22,031 |
) |
| |
|
(Gain) loss on investments |
|
|
(432,993 |
) |
|
(161,846 |
) |
|
6,254 |
|
| |
|
Discontinued operations, net of tax |
|
|
– |
|
|
– |
|
|
(997 |
) |
| |
|
Extraordinary item, net of tax |
|
|
(42,827 |
) |
|
– |
|
|
– |
|
| |
|
Noncash interest expense |
|
|
21,124 |
|
|
21,308 |
|
|
20,365 |
|
| |
|
Other noncash expense |
|
|
1,317 |
|
|
8,533 |
|
|
9,504 |
|
| |
|
Excess tax benefit from exercise of stock awards |
|
|
(28,981 |
) |
|
(5,077 |
) |
|
– |
|
| |
|
Other operating activities |
|
|
(5,000 |
) |
|
3,162 |
|
|
– |
|
| |
Changes in assets and liabilities from operations |
|
|
|
|
|
|
|
|
|
|
| |
|
Change in accounts receivable |
|
|
(88,889 |
) |
|
(89,612 |
) |
|
(94,346 |
) |
| |
|
Change in inventory |
|
|
16,848 |
|
|
(25,287 |
) |
|
(15,460 |
) |
| |
|
Change in accounts payable |
|
|
13,905 |
|
|
(11,319 |
) |
|
33,214 |
|
| |
|
Change in customer deposits and deferred revenues |
|
|
24,725 |
|
|
14,148 |
|
|
7,863 |
|
| |
|
Change in accrued taxes |
|
|
56,225 |
|
|
(24,439 |
) |
|
(3,692 |
) |
| |
|
Change in accrued interest |
|
|
(8,273 |
) |
|
(2,218 |
) |
|
1,010 |
|
| |
|
Change in other assets and liabilities |
|
|
(23,423 |
) |
|
19,161 |
|
|
12,816 |
|
| |
|
|
941,032 |
|
|
892,246 |
|
|
868,212 |
|
| Cash Flows from Investing Activities |
|
|
|
|
|
|
|
|
|
|
| |
Additions to property, plant and equipment |
|
|
(699,566 |
) |
|
(722,458 |
) |
|
(710,507 |
) |
| |
Cash paid for acquisitions, net of cash acquired |
|
|
(23,764 |
) |
|
(145,908 |
) |
|
(191,370 |
) |
| |
Cash received from divestitures |
|
|
4,277 |
|
|
102,305 |
|
|
500 |
|
| |
Proceeds from sales of investments |
|
|
92,002 |
|
|
102,549 |
|
|
– |
|
| |
Proceeds from return of investments |
|
|
– |
|
|
36,202 |
|
|
– |
|
| |
Other investing activities |
|
|
(804 |
) |
|
(3,430 |
) |
|
(1,040 |
) |
| |
|
|
(627,855 |
) |
|
(630,740 |
) |
|
(902,417 |
) |
| Cash Flows from Financing Activities |
|
|
|
|
|
|
|
|
|
|
| |
Issuance of notes payable |
|
|
25,000 |
|
|
415,000 |
|
|
510,000 |
|
| |
Issuance of long-term debt |
|
|
2,857 |
|
|
4,082 |
|
|
113,139 |
|
| |
Repayment of notes payable |
|
|
(60,000 |
) |
|
(515,000 |
) |
|
(405,000 |
) |
| |
Repayment of long-term debt |
|
|
(3,552 |
) |
|
(204,779 |
) |
|
(242,168 |
) |
| |
Redemption of medium-term notes |
|
|
– |
|
|
(35,000 |
) |
|
(17,200 |
) |
| |
TDS Common Shares and Special Common Shares issued for benefit plans |
|
|
113,605 |
|
|
24,831 |
|
|
20,227 |
|
| |
Excess tax benefit from exercise of stock awards |
|
|
28,981 |
|
|
5,077 |
|
|
– |
|
| |
U.S. Cellular Common Shares issued for benefit plans |
|
|
10,073 |
|
|
15,909 |
|
|
23,345 |
|
| |
Repurchase of TDS Special Common Shares |
|
|
(126,668 |
) |
|
– |
|
|
– |
|
| |
Repurchase of U.S. Cellular Common Shares |
|
|
(87,902 |
) |
|
– |
|
|
– |
|
| |
Dividends paid |
|
|
(45,830 |
) |
|
(43,040 |
) |
|
(40,576 |
) |
| |
Capital distributions to minority partners |
|
|
(8,559 |
) |
|
(13,560 |
) |
|
(2,573 |
) |
| |
Other financing activities |
|
|
(61 |
) |
|
2,508 |
|
|
(303 |
) |
| |
|
|
(152,056 |
) |
|
(343,972 |
) |
|
(41,109 |
) |
Net Increase (Decrease) in Cash and Cash Equivalents |
|
|
161,121 |
|
|
(82,466 |
) |
|
(75,314 |
) |
| Cash and Cash Equivalents |
|
|
|
|
|
|
|
|
|
|
| |
Beginning of year |
|
|
1,013,325 |
|
|
1,095,791 |
|
|
1,171,105 |
|
| |
End of year |
|
$ |
1,174,446 |
|
$ |
1,013,325 |
|
$ |
1,095,791 |
|
The accompanying notes are an integral part of these consolidated financial statements.
Telephone and Data Systems, Inc. and Subsidiaries - Consolidated Balance Sheets–Assets
December 31,
|
|
2007 |
|
2006 |
(Dollars in thousands)
|
|
|
| Current Assets |
|
|
|
|
|
|
| |
Cash and cash equivalents |
|
$ |
1,174,446 |
|
$ |
1,013,325 |
| |
Accounts receivable |
|
|
|
|
|
|
| |
|
Due from customers, less allowance of $16,326 and $15,807, respectively |
|
|
379,558 |
|
|
357,279 |
| |
|
Other, principally connecting companies, less allowance of $5,297 and $9,576, respectively |
|
|
150,863 |
|
|
162,888 |
| |
Marketable equity securities |
|
|
1,917,893 |
|
|
1,205,344 |
| |
Inventory |
|
|
115,818 |
|
|
128,981 |
| |
Prepaid expenses |
|
|
77,155 |
|
|
43,529 |
| |
Other current assets |
|
|
59,855 |
|
|
61,738 |
| |
|
|
3,875,588 |
|
|
2,973,084 |
Investments |
|
|
|
|
|
|
| |
Marketable equity securities |
|
|
1 |
|
|
1,585,286 |
| |
Licenses |
|
|
1,516,629 |
|
|
1,520,407 |
| |
Goodwill |
|
|
679,129 |
|
|
647,853 |
| |
Customer lists, net of accumulated amortization of $82,243 and $68,110, respectively |
|
|
25,851 |
|
|
26,196 |
| |
Investments in unconsolidated entities |
|
|
206,418 |
|
|
197,636 |
| |
Notes receivable, less valuation allowance of $55,144 and $55,144, respectively |
|
|
8,231 |
|
|
7,916 |
| |
Other investments |
|
|
3,277 |
|
|
3,157 |
| |
|
|
2,439,536 |
|
|
3,988,451 |
Property, Plant and Equipment |
|
|
|
|
|
|
| |
In service and under construction |
|
|
8,064,229 |
|
|
7,700,746 |
| |
Less accumulated depreciation |
|
|
4,539,127 |
|
|
4,119,360 |
| |
|
|
3,525,102 |
|
|
3,581,386 |
Other Assets and Deferred Charges |
|
|
53,917 |
|
|
56,593 |
Total Assets |
|
$ |
9,894,143 |
|
$ |
10,599,514 |
The accompanying notes are an integral part of these consolidated financial statements.
Telephone and Data Systems, Inc. and Subsidiaries - Consolidated Balance Sheets–Liabilities and Stockholders' Equity
December 31,
|
|
2007 |
|
2006 |
|
(Dollars in thousands)
|
|
|
|
| Current Liabilities |
|
|
|
|
|
|
|
| |
Current portion of long-term debt |
|
$ |
3,860 |
|
$ |
2,917 |
|
| |
Forward contracts |
|
|
1,005,512 |
|
|
738,408 |
|
| |
Notes payable |
|
|
– |
|
|
35,000 |
|
| |
Accounts payable |
|
|
308,882 |
|
|
294,932 |
|
| |
Customer deposits and deferred revenues |
|
|
166,191 |
|
|
141,164 |
|
| |
Accrued interest |
|
|
18,456 |
|
|
26,729 |
|
| |
Accrued taxes |
|
|
40,439 |
|
|
38,324 |
|
| |
Accrued compensation |
|
|
91,703 |
|
|
72,804 |
|
| |
Derivative liability |
|
|
711,692 |
|
|
359,970 |
|
| |
Net deferred income tax liability |
|
|
327,162 |
|
|
236,397 |
|
| |
Other current liabilities |
|
|
125,622 |
|
|
138,086 |
|
| |
|
|
2,799,519 |
|
|
2,084,731 |
|
Deferred Liabilities and Credits |
|
|
|
|
|
|
|
| |
Net deferred income tax liability |
|
|
555,593 |
|
|
950,348 |
|
| |
Derivative liability |
|
|
– |
|
|
393,776 |
|
| |
Asset retirement obligation |
|
|
173,468 |
|
|
232,312 |
|
| |
Other deferred liabilities and credits |
|
|
154,602 |
|
|
136,733 |
|
| |
|
|
883,663 |
|
|
1,713,169 |
|
Long-Term Debt |
|
|
|
|
|
|
|
| |
Long-term debt, excluding current portion |
|
|
1,632,226 |
|
|
1,633,308 |
|
| |
Forward contracts |
|
|
– |
|
|
987,301 |
|
| |
|
|
1,632,226 |
|
|
2,620,609 |
|
Commitments and Contingencies |
|
|
|
|
|
|
|
Minority Interest in Subsidiaries |
|
|
651,537 |
|
|
609,722 |
|
Preferred Shares |
|
|
860 |
|
|
863 |
|
Common Stockholders' Equity |
|
|
|
|
|
|
|
| |
Common
Shares, par value $.01 per share; authorized 100,000,000 shares;
issued 56,581,000 and 56,558,000 shares, respectively |
|
|
566 |
|
|
566 |
|
| |
Special
Common Shares, par value $.01 per share; authorized
165,000,000 shares; issued 62,946,000 and 62,941,000 shares,
respectively |
|
|
629 |
|
|
629 |
|
| |
Series A
Common Shares, par value $.01 per share; authorized
25,000,000 shares; issued and outstanding 6,442,000 and
6,445,000 shares, respectively |
|
|
64 |
|
|
64 |
|
| |
Capital in excess of par value |
|
|
2,048,110 |
|
|
1,992,597 |
|
| |
Treasury Shares at cost: |
|
|
|
|
|
|
|
| |
|
Common Shares, 3,433,000 and 4,676,000 shares, respectively |
|
|
(120,544 |
) |
|
(187,103 |
) |
| |
|
Special Common Shares 4,712,000 and 4,676,000 shares, respectively |
|
|
(204,914 |
) |
|
(187,016 |
) |
| |
Accumulated other comprehensive income |
|
|
511,776 |
|
|
522,113 |
|
| |
Retained earnings |
|
|
1,690,651 |
|
|
1,428,570 |
|
| |
|
|
3,926,338 |
|
|
3,570,420 |
|
Total Liabilities and Stockholders' Equity |
|
$ |
9,894,143 |
|
$ |
10,599,514 |
|
The accompanying notes are an integral part of these consolidated financial statements.
Telephone and Data Systems, Inc. and Subsidiaries - Consolidated Statements of Common Stockholders' Equity
|
|
|
|
|
|
|
|
|
Treasury Shares |
|
|
|
Accumulated
Other
Comprehensive
Income (Loss) |
|
|
|
|
Common
Shares |
|
Special
Common
Shares |
|
Series A
Common
Shares |
|
Capital in
Excess of
Par Value |
|
Common
Shares |
|
Special
Common
Shares |
|
Comprehensive
Income (Loss) |
|
Retained
Earnings |
|
| (Dollars in thousands) |
|
|
| Balance, December 31, 2004 |
$ |
564 |
|
$ |
– |
|
$ |
64 |
|
$ |
1,957,321 |
|
$ |
(449,173 |
) |
$ |
– |
|
|
|
|
$ |
863,950 |
|
$ |
703,317 |
|
Comprehensive Income: |
|
|
|
|
|
|
|
|
|
|
|
|
|
|
|
|
|
|
|
|
|
|
|
|
|
|
|
| |
Net income |
|
– |
|
|
– |
|
|
– |
|
|
– |
|
|
– |
|
|
– |
|
$ |
647,740 |
|
|
– |
|
|
647,740 |
|
| |
Net unrealized losses on securities |
|
– |
|
|
– |
|
|
– |
|
|
– |
|
|
– |
|
|
– |
|
|
(499,437 |
) |
|
(499,437 |
) |
|
– |
|
| |
Net unrealized losses on derivative instruments |
|
– |
|
|
– |
|
|
– |
|
|
– |
|
|
– |
|
|
– |
|
|
(872 |
) |
|
(872 |
) |
|
– |
|
| |
Comprehensive income |
|
|
|
|
|
|
|
|
|
|
|
|
|
|
|
|
|
|
$ |
147,431 |
|
|
|
|
|
|
|
| Dividends: |
|
|
|
|
|
|
|
|
|
|
|
|
|
|
|
|
|
|
|
|
|
|
|
|
|
|
|
| |
Common, Special Common and Series A Common Shares |
|
– |
|
|
– |
|
|
– |
|
|
– |
|
|
– |
|
|
– |
|
|
|
|
|
– |
|
|
(40,374 |
) |
| |
Preferred Shares |
|
– |
|
|
– |
|
|
– |
|
|
– |
|
|
– |
|
|
– |
|
|
|
|
|
– |
|
|
(202 |
) |
| Distribution of Special Common Shares |
|
– |
|
|
629 |
|
|
– |
|
|
– |
|
|
217,231 |
|
|
(217,231 |
) |
|
|
|
|
– |
|
|
(629 |
) |
| Dividend reinvestment plan |
|
1 |
|
|
– |
|
|
– |
|
|
7,259 |
|
|
– |
|
|
– |
|
|
|
|
|
– |
|
|
– |
|
| Incentive and compensation plans |
|
– |
|
|
– |
|
|
– |
|
|
(17,344 |
) |
|
23,786 |
|
|
6,631 |
|
|
|
|
|
|
|
|
|
|
Adjust investment in subsidiaries for repurchases,
issuances and other compensation plans |
|
– |
|
|
– |
|
|
– |
|
|
11,127 |
|
|
– |
|
|
– |
|
|
|
|
|
– |
|
|
– |
|
| Stock-based compensation awards(3) |
|
– |
|
|
– |
|
|
– |
|
|
1,875 |
|
|
– |
|
|
– |
|
|
|
|
|
– |
|
|
– |
|
| Other |
|
– |
|
|
– |
|
|
– |
|
|
962 |
|
|
– |
|
|
– |
|
|
|
|
|
– |
|
|
– |
|
| Balance, December 31, 2005 |
$ |
565 |
|
$ |
629 |
|
$ |
64 |
|
$ |
1,961,200 |
|
$ |
(208,156 |
) |
$ |
(210,600 |
) |
|
|
|
$ |
363,641 |
|
$ |
1,309,852 |
|
Comprehensive Income: |
|
|
|
|
|
|
|
|
|
|
|
|
|
|
|
|
|
|
|
|
|
|
|
|
|
|
|
| |
Net income |
|
– |
|
|
– |
|
|
– |
|
|
– |
|
|
– |
|
|
– |
|
$ |
161,759 |
|
|
– |
|
|
161,759 |
|
| |
Net unrealized gains on securities |
|
– |
|
|
– |
|
|
– |
|
|
– |
|
|
– |
|
|
– |
|
|
171,705 |
|
|
171,705 |
|
|
– |
|
| |
Net unrealized losses on derivative instruments |
|
– |
|
|
– |
|
|
– |
|
|
– |
|
|
– |
|
|
– |
|
|
(490 |
) |
|
(490 |
) |
|
– |
|
| |
Additional liability of defined benefit pension plan(1) |
|
– |
|
|
– |
|
|
– |
|
|
– |
|
|
– |
|
|
– |
|
|
(322 |
) |
|
(322 |
) |
|
– |
|
| |
Comprehensive income |
|
|
|
|
|
|
|
|
|
|
|
|
|
|
|
|
|
|
$ |
332,652 |
|
|
|
|
|
|
|
| |
Application of provisions of SFAS 158 on post-retirement plans |
|
– |
|
|
– |
|
|
– |
|
|
– |
|
|
– |
|
|
– |
|
|
|
|
|
(12,421 |
) |
|
– |
|
| Dividends: |
|
|
|
|
|
|
|
|
|
|
|
|
|
|
|
|
|
|
|
|
|
|
|
|
|
|
|
| |
Common, Special Common and Series A Common Shares |
|
– |
|
|
– |
|
|
– |
|
|
– |
|
|
– |
|
|
– |
|
|
|
|
|
– |
|
|
(42,876 |
) |
| |
Preferred Shares |
|
– |
|
|
– |
|
|
– |
|
|
– |
|
|
– |
|
|
– |
|
|
|
|
|
– |
|
|
(165 |
) |
| Conversion of Series A and Preferred Series TT Shares(2) |
|
1 |
|
|
– |
|
|
– |
|
|
3,000 |
|
|
– |
|
|
– |
|
|
|
|
|
– |
|
|
– |
|
| Dividend reinvestment plan |
|
– |
|
|
– |
|
|
– |
|
|
1,613 |
|
|
– |
|
|
– |
|
|
|
|
|
– |
|
|
– |
|
| Incentive and compensation plans |
|
– |
|
|
– |
|
|
– |
|
|
(15,451 |
) |
|
21,053 |
|
|
23,222 |
|
|
|
|
|
– |
|
|
– |
|
Adjust investment in subsidiaries for repurchases,
issuances and other compensation plans |
|
– |
|
|
– |
|
|
– |
|
|
14,079 |
|
|
– |
|
|
– |
|
|
|
|
|
– |
|
|
– |
|
| Stock-based compensation awards(3) |
|
– |
|
|
– |
|
|
– |
|
|
22,992 |
|
|
– |
|
|
362 |
|
|
|
|
|
– |
|
|
– |
|
| Tax windfall benefits from stock award exercises(4) |
|
– |
|
|
– |
|
|
– |
|
|
5,173 |
|
|
– |
|
|
– |
|
|
|
|
|
– |
|
|
– |
|
| Other |
|
– |
|
|
– |
|
|
– |
|
|
(9 |
) |
|
– |
|
|
– |
|
|
|
|
|
– |
|
|
– |
|
| Balance, December 31, 2006 |
$ |
566 |
|
$ |
629 |
|
$ |
64 |
|
$ |
1,992,597 |
|
$ |
(187,103 |
) |
$ |
(187,016 |
) |
|
|
|
$ |
522,113 |
|
$ |
1,428,570 |
|
| Comprehensive Income: |
|
|
|
|
|
|
|
|
|
|
|
|
|
|
|
|
|
|
|
|
|
|
|
|
|
|
|
| |
Net income |
|
– |
|
|
– |
|
|
– |
|
|
– |
|
|
– |
|
|
– |
|
$ |
386,112 |
|
|
– |
|
$ |
386,112 |
|
| |
Net unrealized losses on securities |
|
– |
|
|
– |
|
|
– |
|
|
– |
|
|
– |
|
|
– |
|
|
(114,907 |
) |
|
(114,907 |
) |
|
– |
|
| |
Net unrealized gains on derivative instruments |
|
– |
|
|
– |
|
|
– |
|
|
– |
|
|
– |
|
|
– |
|
|
80,122 |
|
|
80,122 |
|
|
– |
|
| |
Changes in plan assets and projected benefit obligation related to retirement plans |
|
– |
|
|
– |
|
|
– |
|
|
– |
|
|
– |
|
|
– |
|
|
3,403 |
|
|
3,403 |
|
|
– |
|
| |
Termination of defined benefit pension plan(1) |
|
– |
|
|
– |
|
|
– |
|
|
– |
|
|
– |
|
|
– |
|
|
322 |
|
|
322 |
|
|
– |
|
| |
Comprehensive income |
|
|
|
|
|
|
|
|
|
|
|
|
|
|
|
|
|
|
$ |
355,052 |
|
|
|
|
|
|
|
| Application of provisions of FIN 48 |
|
– |
|
|
– |
|
|
– |
|
|
– |
|
|
– |
|
|
– |
|
|
|
|
|
20,723 |
|
|
(16,323 |
) |
| Dividends: |
|
|
|
|
|
|
|
|
|
|
|
|
|
|
|
|
|
|
|
|
|
|
|
|
|
|
|
| |
Common, Special Common and Series A Common Shares |
|
– |
|
|
– |
|
|
– |
|
|
– |
|
|
– |
|
|
– |
|
|
|
|
|
– |
|
|
(45,778 |
) |
| |
Preferred Shares |
|
– |
|
|
– |
|
|
– |
|
|
– |
|
|
– |
|
|
– |
|
|
|
|
|
– |
|
|
(52 |
) |
| Repurchase of Common Shares |
|
– |
|
|
– |
|
|
– |
|
|
– |
|
|
– |
|
|
(126,668 |
) |
|
|
|
|
– |
|
|
– |
|
| Dividend reinvestment plan |
|
– |
|
|
– |
|
|
– |
|
|
1,483 |
|
|
– |
|
|
– |
|
|
|
|
|
– |
|
|
– |
|
| Incentive and compensation plans |
|
– |
|
|
– |
|
|
– |
|
|
368 |
|
|
66,559 |
|
|
108,770 |
|
|
|
|
|
– |
|
|
(61,878 |
) |
| Adjust investment in subsidiaries for repurchases, issuances and other compensation plans |
|
– |
|
|
– |
|
|
– |
|
|
(28,724 |
) |
|
– |
|
|
– |
|
|
|
|
|
– |
|
|
– |
|
| Stock-based compensation awards(3) |
|
– |
|
|
– |
|
|
– |
|
|
17,219 |
|
|
– |
|
|
– |
|
|
|
|
|
– |
|
|
– |
|
| Tax windfall benefits from stock award exercises(4) |
|
– |
|
|
– |
|
|
– |
|
|
28,376 |
|
|
– |
|
|
– |
|
|
|
|
|
– |
|
|
– |
|
| Impact of U.S. Cellular's Accelerated Share Repurchase program(5) |
|
– |
|
|
– |
|
|
– |
|
|
37,155 |
|
|
– |
|
|
– |
|
|
|
|
|
– |
|
|
– |
|
| Other |
|
– |
|
|
– |
|
|
– |
|
|
(364 |
) |
|
– |
|
|
– |
|
|
|
|
|
– |
|
|
– |
|
| Balance, December 31, 2007 |
$ |
566 |
|
$ |
629 |
|
$ |
64 |
|
$ |
2,048,110 |
|
$ |
(120,544 |
) |
$ |
(204,914 |
) |
|
|
|
$ |
511,776 |
|
$ |
1,690,651 |
|
The accompanying notes are an integral part of these consolidated financial statements.
Telephone and Data Systems, Inc. and Subsidiaries - Notes to Consolidated Financial Statements
NOTE 1 SUMMARY OF SIGNIFICANT ACCOUNTING POLICIES
Nature of Operations
Telephone
and Data Systems, Inc. ("TDS") is a diversified telecommunications
company providing high-quality telecommunications services in
36 states to approximately 6.1 million wireless customers and
1.2 million wireline telephone equivalent access lines at
December 31, 2007. TDS conducts substantially all of its wireless
telephone operations through its 80.8%-owned subsidiary, United States
Cellular Corporation ("U.S. Cellular") and its incumbent local
exchange carrier ("ILEC") and competitive local exchange carrier
("CLEC") wireline telephone operations through its wholly owned
subsidiary, TDS Telecommunications Corporation
("TDS Telecom"). TDS conducts printing and distribution services
through its 80%-owned subsidiary, Suttle Straus, Inc. ("Suttle
Straus"), which represents a small portion of TDS' operations.
See
Note 23–Business Segment Information, for summary financial information on each business segment.
Principles of Consolidation
The
accounting policies of TDS conform to accounting principles generally
accepted in the United States of America ("U.S. GAAP"). The
consolidated financial statements include the accounts of TDS, its
majority-owned subsidiaries, the wireless partnerships in which it has
a majority general partnership interest and any entity in which TDS has
a variable interest that requires TDS to recognize a majority of the
entity's expected gains or losses. All material intercompany items have
been eliminated.
Reclassifications
Certain
prior-year amounts have been reclassified to conform to the 2007
financial statement presentation. These reclassifications did not
affect consolidated net income, assets, liabilities or shareholders'
equity for the years presented.
Business Combinations
TDS
uses the purchase method of accounting for business combinations and,
therefore, costs of acquisitions include the value of the consideration
given and all related direct and incremental costs. All costs relating
to unsuccessful negotiations for acquisitions are charged to expense
when the acquisition is no longer considered probable.
Use of Estimates
The
preparation of consolidated financial statements in conformity with
U.S. GAAP requires management to make estimates and assumptions
that affect (a) the reported amounts of assets and liabilities and
disclosure of contingent assets and liabilities at the date of the
financial statements and (b) the reported amounts of revenues and
expenses during the reported period. Actual results could differ from
those estimates. Significant estimates are involved in accounting for
revenue, contingencies and commitments, goodwill and indefinite-lived
intangible assets, asset retirement obligations, derivatives,
depreciation, amortization and accretion, allowance for doubtful
accounts, stock-based compensation and income taxes.
Stock Dividend
TDS
distributed one Special Common Share in the form of a stock dividend
with respect to each outstanding Common Share and Series A Common
Share of TDS on May 13, 2005 to shareholders of record on
April 29, 2005.
Cash and Cash Equivalents
Cash
and cash equivalents include cash and those short-term, highly liquid
investments with original maturities of three months or less.
Outstanding
checks totaled $10.0 million and $17.2 million at
December 31, 2007 and 2006, respectively, and are classified as
Accounts payable in the Consolidated Balance Sheets.
Accounts Receivable and Allowance for Doubtful Accounts
U.S. Cellular's
accounts receivable primarily consist of amounts owed by customers
pursuant to service contracts and for equipment sales, by agents for
equipment sales, by other wireless carriers whose customers have used
U.S. Cellular's wireless systems and by unaffiliated third-party
partnerships or corporations pursuant to equity distribution
declarations.
TDS Telecom's
accounts receivable primarily consist of amounts owed by customers for
services provided, by connecting companies for carrying interstate and
intrastate long-distance traffic on its network, and by interstate and
intrastate revenue pools that distribute access charges.
The
allowance for doubtful accounts is the best estimate of the amount of
probable credit losses related to existing accounts receivable. The
allowance is estimated based on historical experience and other factors
that could affect collectibility. Accounts receivable balances are
reviewed on either an aggregate or individual basis for collectibility
depending on the type of receivable. When it is probable that an
account balance will not be collected, the account balance is charged
against the allowance for doubtful accounts. TDS does not have any
off-balance sheet credit exposure related to its customers.
The
changes in the allowance for doubtful accounts during the years ended December 31, 2007, 2006 and 2005 were as follows:
Year Ended December 31,
|
|
2007 |
|
2006 |
|
2005 |
|
(Dollars in thousands)
|
|
|
|
| Beginning Balance |
|
$ |
25,383 |
|
$ |
20,820 |
|
$ |
17,487 |
|
| |
Additions, net of recoveries |
|
|
74,988 |
|
|
70,366 |
|
|
46,427 |
|
| |
Deductions |
|
|
(78,748 |
) |
|
(65,803 |
) |
|
(43,094 |
) |
| Ending Balance |
|
$ |
21,623 |
|
$ |
25,383 |
|
$ |
20,820 |
|
Inventory
Inventory
primarily consists of handsets stated at the lower of cost or market,
with cost determined using the first-in, first-out method and market
determined by replacement costs. TDS Telecom's materials and
supplies are stated at average cost.
Marketable Equity Securities
Marketable
equity securities are classified as available-for-sale and are stated
at fair market value. Net unrealized holding gains and losses are
included in Accumulated other comprehensive income, net of tax.
Realized gains and losses recognized at the time of sale are determined
on the basis of specific identification.
The
market values of marketable equity securities may fall below the
accounting cost basis of such securities. If management determines the
decline in value to be other than temporary, the unrealized loss
included in Accumulated other comprehensive income is recognized and
recorded as a non-operating loss in the Consolidated Statements of
Operations.
Factors
that management considers in determining whether a decrease in the
market value of its marketable equity securities is an
other-than-temporary decline include: whether there has been a
significant change in the financial condition, operational structure or
near-term prospects of the issuer of the security; how long and how
much the market value of the security has been below the accounting
cost basis; and whether TDS has the intent and ability to retain its
investment in the issuer's securities to allow the market value to
return to the accounting cost basis.
TDS
uses derivative financial instruments to reduce risks related to
fluctuations in market prices of marketable equity securities. At
December 31, 2007 and 2006, TDS had variable prepaid forward
contracts ("forward contracts") in place with respect to substantially
all TDS' marketable equity security portfolio, hedging the market price
risk with respect to the contracted securities. Some of these forward
contracts matured in 2007 and the remaining contracts mature in 2008.
The downside market risk is hedged at or above the accounting cost
basis of the securities.
Derivative Financial Instruments
DS
uses derivative financial instruments to reduce marketable equity
security market value risk. TDS does not hold or issue derivative
financial instruments for trading purposes. TDS recognizes all
derivatives as either assets or liabilities on the Consolidated Balance
Sheets and measures those instruments at fair value. Changes in fair
value of those instruments are reported in the Consolidated Statements
of Operations or classified as Accumulated other comprehensive income,
net of tax, in the Consolidated Balance Sheets depending on the use of
the derivative and whether it qualifies for hedge accounting. The
accounting for gains and losses associated with changes in the fair
value of the derivative and the effect on the consolidated financial
statements depends on the derivative's hedge designation and whether
the hedge is anticipated to be highly effective in achieving offsetting
changes in the fair value of the hedged item or cash flows of the asset
hedged.
TDS
originally designated the embedded collars within its forward contracts
related to Deutsche Telekom and Vodafone marketable equity securities
as cash flow hedges. Accordingly, all changes in the fair value of the
embedded collars were recorded in Other comprehensive income, net of
income taxes. Subsequently, upon contractual modifications to the terms
of the collars in September 2002, the embedded collars no longer
qualified for hedge accounting treatment and all changes in fair value
of the collars from the time of the contractual modification to the
termination or settlement of the collars are included in the
Consolidated Statements of Operations.
The
VeriSign forward contract was designated as a fair value hedge. Changes
in the fair value of the embedded collars were recognized in the
Consolidated Statements of Operations.
Licenses
Licenses
consist of costs incurred in acquiring Federal Communications
Commission ("FCC") licenses to provide wireless and fixed wireless
service. These costs include amounts paid to license applicants and
owners of interests in entities awarded licenses and all direct and
incremental costs related to acquiring the licenses. TDS has also
allocated amounts to Licenses in conjunction with step acquisitions
related to U.S. Cellular's repurchase of U.S. Cellular common
shares.
TDS
accounts for wireless licenses in accordance with the provisions of
Financial Accounting Standards Board ("FASB") Statement of Financial
Accounting Standards ("SFAS") No. 142, Goodwill and Other Intangible
Assets ("SFAS 142"). In accordance with SFAS 142, TDS has determined that such wireless licenses have
indefinite lives and, therefore, that the costs of the licenses are not subject to amortization.
TDS
has determined that licenses are intangible assets with indefinite useful lives, based on the following factors:
- Radio
spectrum is not a depleting asset.
- The
ability to use radio spectrum is not limited to any one technology.
- U.S. Cellular
and its consolidated subsidiaries are licensed to use radio spectrum
through the FCC licensing process, which enables licensees to utilize
specified portions of the spectrum for the provision of wireless
service.
- U.S. Cellular
and its consolidated subsidiaries are required to renew their FCC
licenses every ten years. From the inception of U.S. Cellular to
date, all of U.S. Cellular's license renewal applications have
been granted by the FCC. Generally, license renewal applications filed
by licensees otherwise in compliance with FCC regulations are routinely
granted. If, however, a license renewal application is challenged,
either by a competing applicant for the license or by a petition to
deny the renewal application, the license will be renewed if the
licensee can demonstrate its entitlement to a "renewal expectancy."
Licensees are entitled to such an expectancy if they can demonstrate to
the FCC that they have provided "substantial service" during their
license term and have "substantially complied" with FCC rules and
policies. U.S. Cellular believes that it could demonstrate its
entitlement to a renewal expectancy in any of its markets in the
unlikely event that any of its license renewal applications were
challenged and, therefore, believes that it is probable that its future
license renewal applications will be granted.
Goodwill
TDS
has goodwill as a result of its acquisitions of licenses and wireless
markets, the acquisition of operating telephone companies and step
acquisitions related to U.S. Cellular's repurchase of
U.S. Cellular common shares. Such goodwill represents the excess
of the total purchase price of acquisitions over the fair values of
acquired assets, including licenses and other identifiable intangible
assets, and liabilities assumed.
Impairment of Intangible Assets
Licenses
and goodwill must be reviewed for impairment annually or more
frequently if events or changes in circumstances indicate that the
asset might be impaired. TDS performs the annual impairment review on
licenses and goodwill during the second quarter of its fiscal year.
The
intangible asset impairment test consists of comparing the fair value
of the intangible asset to the carrying amount of the intangible asset.
If the carrying amount exceeds the fair value, an impairment loss is
recognized for the difference. The goodwill impairment test is a
two-step process. The first step compares the fair value of the
reporting unit to its carrying value. If the carrying amount exceeds
the fair value, the second step of the test is performed to measure the
amount of impairment loss, if any. The second step compares the implied
fair value of reporting unit goodwill with the carrying amount of that
goodwill. To calculate the implied fair value of goodwill, an
enterprise allocates the fair value of the reporting unit to all of the
assets and liabilities of that reporting unit (including any
unrecognized intangible assets) as if the reporting unit had been
acquired in a business combination and the fair value was the price
paid to acquire the reporting unit. The excess of the fair value of the
reporting unit over the amounts assigned to the assets and liabilities
of the reporting unit is the implied fair value of goodwill. If the
carrying amount exceeds the implied fair value, an impairment loss is
recognized for that difference.
The
fair value of an intangible asset or reporting unit is the amount at
which that asset or reporting unit could be bought or sold in a current
transaction between willing parties. Therefore, quoted market prices
in active markets are the best evidence of fair value and should be
used when available. If quoted market prices are not available, the
estimate of fair value is based on the best information available,
including prices for similar assets and the use of other valuation
techniques. Other valuation techniques include present value analysis,
multiples of earnings or revenue or a similar performance measure. The
use of these techniques involve assumptions by management about factors
that are highly uncertain including future cash flows, the appropriate
discount rate, and other inputs. Different assumptions for these inputs
or valuation methodologies could create materially different results.
U.S. Cellular
tests goodwill for impairment at the level of reporting referred to as
a reporting unit. For purposes of impairment testing of goodwill in
2007, 2006 and 2005, U.S. Cellular identified five reporting units
pursuant to paragraph 30 of SFAS 142. The five reporting
units represent five geographic service areas.
For
purposes of impairment testing of goodwill, U.S. Cellular prepares
valuations of each of the five reporting units. A discounted cash flow
approach is used to value each of the reporting units, using value
drivers and risks specific to each individual geographic region. The
cash flow estimates incorporate assumptions that market participants
would use in their estimates of fair value. Key assumptions made in
this process are the selection of a discount rate, estimated future
cash flows, projected capital expenditures, and selection of terminal
value multiples.
U.S.
Cellular tests licenses for impairment at the level of reporting
referred to as a unit of accounting. For purposes of impairment testing
of licenses in 2007, 2006 and 2005, U.S. Cellular combined its FCC
licenses into eleven, eleven and five units of accounting,
respectively, pursuant to FASB Emerging Issues Task Force ("EITF")
Issue 02-7, Units of Accounting for Testing Impairment of
Indefinite-Lived Assets
("EITF 02-7") and SFAS 142. In 2007 and 2006, six such units
of accounting represent geographic groupings of licenses which, because
they are currently undeveloped and not expected to generate cash flows
from operating activities in the foreseeable future, are considered
separate units of accounting for purposes of impairment.
For
purposes of impairment testing of licenses, U.S. Cellular prepares
valuations of each of the units of accounting which consist of
developed licenses using an excess earnings methodology. This excess
earnings methodology estimates the fair value of the intangible assets
(FCC license units of accounting) by measuring the future cash flows of
the license groups, reduced by charges for contributory assets such as
working capital, trademarks, existing subscribers, fixed assets,
assembled workforce and goodwill. For units of accounting which consist
of undeveloped licenses, U.S. Cellular prepares estimates of fair
value by reference to fair market values indicated by recent auctions
and market transactions.
TDS
has recorded amounts as licenses and goodwill as a result of accounting
for U.S. Cellular's purchases of U.S. Cellular common shares
as step acquisitions using purchase accounting. TDS' ownership
percentage of U.S. Cellular increases upon these
U.S. Cellular share repurchases. The purchase price in excess of
the fair value of the net assets acquired is allocated principally to
licenses and goodwill. For impairment testing purposes, the additional
TDS licenses and goodwill amounts are allocated to the same units of
accounting and reporting units used by U.S. Cellular. In 2003,
U.S. Cellular's license and goodwill impairment tests did not
result in an impairment loss on a stand-alone basis. However, when the
license and goodwill amounts recorded at TDS, as a result of the step
acquisitions, were added to the U.S. Cellular licenses and
goodwill for impairment testing at the TDS consolidated level in 2003,
an impairment loss on licenses and goodwill was recorded. Consequently,
U.S. Cellular's license and goodwill balances reported on a
stand-alone basis do not match the TDS consolidated license and
goodwill balances for U.S. Cellular.
TDS Telecom
has recorded goodwill primarily as a result of the acquisition of
operating telephone companies. TDS Telecom has assigned goodwill
to its ILEC reporting unit and, for purposes of impairment testing,
valued this goodwill using a multiple of cash flow valuation technique.
Investments in Unconsolidated Entities
Investments
in unconsolidated entities consists of investments in which TDS holds a
non-controlling ownership interest of less than 50%. TDS follows the
equity method of accounting for such investments in which its ownership
interest equals or exceeds 20% for corporations and equals or exceeds
3% for partnerships and limited liability companies. The cost method of
accounting is followed for such investments in which TDS' ownership
interest is less than 20% for corporations and is less than 3% for
partnerships and limited liability companies, and for investments for
which TDS does not have the ability to exercise significant influence.
For
its equity method investments for which financial information is
readily available, TDS records its equity in the earnings of the entity
in the current period. For its equity method investments for which
financial information is not readily available, TDS records its equity
in the earnings of the entity on generally a one quarter lag basis.
Property, Plant and Equipment
U.S. Cellular
U.S. Cellular's
property, plant and equipment is stated at the original cost of
construction or purchase including capitalized costs of certain taxes,
payroll-related expenses and estimated costs to remove the assets.
Renewals
and betterments of units of property are recorded as additions to plant
in service. Retirements of units of property are recorded by removing
the original cost of the property (along with the related accumulated
depreciation) from plant in service and charging it, together with
removal cost less any salvage realized, to depreciation expense.
Repairs and renewals of minor units of property are charged to system
operations expense.
Costs
of developing new information systems are capitalized in accordance with Statement of Position 98-1, Accounting for the Cost of Computer
Software Developed or Obtained for Internal Use ("SOP 98-1"), and amortized starting when each new system is placed in service.
TDS Telecom
ILEC Operations
TDS Telecom's
ILEC property, plant and equipment is stated at the original cost of
construction including the capitalized costs of certain taxes,
payroll-related expenses, an allowance for funds used during
construction and estimated costs to remove the assets.
Prior
to the third quarter of 2007, TDS' ILEC operations followed accounting
for regulated enterprises prescribed by SFAS No. 71, Accounting for the
Effects of Certain Types of Regulation
("SFAS 71"). In the third quarter of 2007, management determined
that it was no longer appropriate to continue the application of
SFAS 71 for reporting its financial results. See
Note 5–Extraordinary Item–Discontinuance of the Application of
Statement of Financial Accounting Standards No. 71, Accounting for
the Effects of Certain Types of Regulation, for further information.
Renewals
and betterments of units of property are recorded as additions to
telephone plant in service. Repairs and renewals of minor units of
property are charged to plant operations expense. The original
cost of depreciable property retired is removed from plant in service
and, prior to the discontinuance of SFAS 71, the removal cost less
any salvage realized was charged to a regulatory liability with no gain
or loss being recognized on the ordinary retirement of depreciable
telephone property. Subsequent to the discontinuance of SFAS 71,
the cost of removal is charged to depreciation expense with any salvage
realized recorded to accumulated depreciation.
Costs
of developing new information systems are capitalized in accordance
with SOP 98-1 and amortized starting when each new system is
placed in service.
CLEC Operations
TDS Telecom's
CLEC property, plant and equipment is stated at the original cost of
construction including capitalized costs of certain taxes,
payroll-related expenses and estimated costs to remove the assets.
Renewals
and betterments of units of property are recorded as additions to plant
in service. The original cost of depreciable property retired (along
with the related accumulated depreciation) is removed from plant in
service and, together with removal cost less any salvage realized, is
charged to depreciation expense. Repairs and renewals of minor units of
property are charged to maintenance expense.
Costs
of developing new information systems are capitalized in accordance
with SOP 98-1 and amortized starting when each new system is
placed in service.
Depreciation
TDS
provides for depreciation using the straight-line method over the
estimated useful life of the assets. However, prior to the
discontinuance of SFAS 71 in the third quarter of 2007,
TDS Telecom's ILEC operations provided for depreciation according
to depreciable rates approved by state public utility commissions.
TDS
depreciates leasehold improvement assets associated with leased
properties over periods ranging from one to thirty years; such periods
approximate the shorter of the assets' economic lives or the specific
lease terms, as defined in SFAS No. 13, Accounting for Leases ("SFAS 13"), as amended.
Impairment of Long-lived Assets
TDS
reviews long-lived assets for impairment whenever events or changes in
circumstances indicate that the assets might be impaired. The
impairment test for tangible long-lived assets is a two-step process.
The first step compares the carrying value of the asset with the
estimated undiscounted cash flows over the remaining asset life. If the
carrying value of the asset is greater than the undiscounted cash
flows, then the second step of the test is performed to measure the
amount of impairment loss. The second step compares the carrying value
of the asset to its estimated fair value. If the carrying value exceeds
the estimated fair value (less cost to sell), an impairment loss is
recognized for the difference.
The
fair value of a tangible long-lived asset is the amount at which that
asset could be bought or sold in a current transaction between willing
parties. Therefore, quoted market prices in active markets are the best
evidence of fair value and should be used when available. If quoted
market prices are not available, the estimate of fair value is based on
the best information available, including prices for similar assets and
the use of other valuation techniques. A present value analysis of cash
flow scenarios is often the best available valuation technique with
which to estimate the fair value of the asset. The use of this
technique involves assumptions by management about factors that are
highly uncertain including future cash
flows, the appropriate discount rate, and other inputs. Different
assumptions for these inputs or the use of different valuation
methodologies could create materially different results.
Other Assets and Deferred Charges
Other
assets and deferred charges primarily represent legal and other charges
related to various borrowing instruments, and are amortized over the
respective term of each instrument. The amounts for Deferred Charges
included in the Consolidated Balance Sheets at December 31, 2007
and 2006 are shown net of accumulated amortization of
$19.9 million and $15.3 million, respectively.
Asset Retirement Obligations
TDS accounts for asset retirement obligations under SFAS No. 143, Accounting for Asset Retirement
Obligations ("SFAS 143"), and FASB Interpretation ("FIN") No. 47, Accounting for Conditional Asset Retirement
Obligations
("FIN 47"), which require entities to record the fair value of a
liability for legal obligations associated with an asset retirement in
the period in which the obligations are incurred. At the time the
liability is incurred, TDS records a liability equal to the net present
value of the estimated cost of the asset retirement obligation and
increases the carrying amount of the related long-lived asset by an
equal amount. Over time, the liability is accreted to its present value
each period, and the capitalized cost is depreciated over the useful
life of the related asset. Upon settlement of the obligation, any
differences between the cost to retire the asset and the recorded
liability (including accretion of discount) is recognized in the
Consolidated Statement of Operations as a gain or loss.
Prior
to the discontinuance of SFAS 71 in the third quarter of 2007,
TDS Telecom's ILEC operations' asset retirement obligations
consisted of a regulatory liability and an additional liability as
required by SFAS 143. These combined amounts made up the asset
retirement obligation for the ILEC as follows:
- The
ILECs had recorded a regulatory liability for the costs of removal that
state public utility commissions had required to be recorded for
regulatory accounting purposes.
- At
the time a liability subject to SFAS 143 was incurred, the ILEC
operations would record a liability equal to the net present value of
the estimated cost of the asset retirement obligation and established a
related long-lived asset of an equal amount. Over time, the liability
was accreted to its future value each period, and the capitalized cost
was depreciated over the useful life of the related asset. Both the
accretion and depreciation were recorded as a regulatory liability with
no impact being recorded in the Consolidated Statement of Operations.
Upon settlement of the obligation, any difference between the cost to
retire an asset and the recorded liability was also recorded as an
adjustment to the regulatory liability account and no gain or loss was
recognized in the Consolidated Statement of Operations.
Treasury Shares
Common
Shares and Special Common Shares repurchased by TDS are recorded at
cost as treasury shares and result in a reduction of shareholders'
equity. Treasury shares are reissued as part of TDS' stock-based
compensation programs. When treasury shares are reissued, TDS
determines the cost using the first-in, first-out cost method. The
difference between the cost of the treasury shares and the reissuance
price is included in additional paid-in capital or retained earnings.
Revenue Recognition
U.S. Cellular
Revenues from wireless operations primarily consist of:
- Charges
for access, airtime, roaming, data and other value added services
provided to U.S. Cellular's retail customers and to end users
through third-party resellers.
- Charges
to carriers whose customers use U.S. Cellular's systems when roaming.
- Charges
for long-distance calls made on U.S. Cellular's systems.
- Sales
of equipment and accessories.
- Amounts
received from the universal service fund in states where
U.S. Cellular has been designated an Eligible Telecommunications
Carrier ("ETC").
Revenues
related to wireless services are recognized as services are rendered.
Revenues billed in advance or in arrears of the services being provided
are estimated and deferred or accrued, as appropriate. Sales of
equipment and accessories represent a separate earnings process.
Revenues from sales of equipment and accessories are recognized upon
delivery to the customer. ETC revenues recognized in the reporting
period represent the amounts which U.S. Cellular is entitled to
receive for such period, as determined and approved in connection with
U.S. Cellular's designation as an ETC in various states.
In
order to provide better control over handset quality,
U.S. Cellular sells handsets to agents. In most cases, the agents
receive rebates from U.S. Cellular at the time the agents activate
new customers for U.S. Cellular service or retain existing
customers. U.S. Cellular accounts for the discount on sales of
handsets to agents in accordance with EITF Issue 01-9, Accounting for Consideration Given by a Vendor to a Customer (Including a Reseller of the Vendor's Products)
("EITF 01-9"). This standard requires that revenue be reduced by
the anticipated rebate to be paid to the agent at the time the agent
purchases the handset rather than at the time the agent enrolls a new
customer or retains a current customer. Similarly, U.S. Cellular
offers certain rebates to retail customers who purchase new handsets;
in accordance with EITF 01-9, the revenue from a handset sale
which includes such a rebate is recorded net of the anticipated rebate.
Activation
fees charged with the sale of service only, where U.S. Cellular
does not also sell a handset to the end user, are deferred and
recognized over the average customer service period. U.S. Cellular
defers recognition of a portion of commission expenses related to
customer activation in the amount of deferred activation fee revenues.
This method of accounting provides for matching of revenues from
customer activations to direct incremental costs associated with such
activations within each reporting period.
Under
EITF Issue 00-21, Accounting for Multiple Element Arrangements
("EITF 00-21"), the activation fee charged with the sale of
equipment and service is allocated to the equipment and service based
upon the relative fair values of each item. This generally results in
the recognition of the activation fee as additional handset revenue at
the time of sale.
TDS Telecom
Revenue from ILECs primarily consists of charges for:
- The
provision of local telephone exchange service;
- Compensation
for carrying interstate and intrastate long-distance traffic on TDS Telecom's local telephone networks;
- Leasing,
selling, installing and maintaining customer premise equipment;
- Providing
billing and collection services;
- Providing
internet services;
- Reselling
long-distance services; and
- Selling
digital broadcast satellite service.
Revenue
from CLECs primarily consists of charges for:
- The
provision of local telephone exchange service;
- Compensation
for carrying interstate and intrastate long-distance traffic on TDS Telecom's local telephone networks; and
- Providing
internet services and reselling long-distance services.
Revenues
are recognized as services are rendered. Activation fees charged are
deferred and recognized over the average customer service period.
TDS Telecom
offers some products and services that are provided by third-party
vendors. The relationships between TDS Telecom, the vendor and the
end customer are reviewed to assess whether revenue should be reported
on a gross or net basis. The evaluation and ultimate determination is
based on indicators provided in EITF Issue No. 99-19, Reporting Revenue Gross as a Principal versus Net as
an Agent
("EITF 99-19"). The primary product TDS Telecom provides
through a third party vendor is satellite television service. TDS
records satellite television service revenue on a net basis in
accordance with the provisions of EITF 99-19.
TDS Telecom
offers discounts and incentives to customers who receive certain
groupings of products and services (bundled arrangements). These
discounts are recognized concurrently with the associated revenue and
are allocated to the various products and services in the bundled
offering based on their relative fair value based on guidance provided
in EITF 00-21. A bundled service offering TDS Telecom
currently offers is telephone service, digital subscriber line ("DSL")
service and satellite television service.
Discounts
and incentives currently offered by TDS Telecom that are given
directly to customers are reviewed and recorded in the financial
statements as a reduction of Operating revenues, based on the
provisions of EITF Issue No. 01-9.
TDS'
ILECs participate in revenue pools with other telephone companies for
interstate revenue and for certain intrastate revenue. Such pools are
funded by toll revenue and/or access charges within state jurisdictions
and by access charges in the interstate market. Revenues earned through
the various pooling processes are recorded based on estimates following
the National Exchange Carrier Association's rules as approved by the
FCC.
Amounts Collected from Customers and Remitted to Governmental Authorities
TDS
records amounts collected from customers and remitted to governmental
authorities net within a tax liability account if the tax is assessed
upon the customer and TDS merely acts as an agent in collecting the tax
on behalf of the imposing governmental authority. If the tax is
assessed upon TDS, then amounts collected from customers as recovery of
the tax are recorded in Operating revenues and amounts remitted to
governmental authorities are recorded in Selling, general and
administrative expenses
in the Consolidated Statements of Operations. The amounts recorded
gross in revenues that are billed to customers and remitted to
governmental authorities totaled $147.8 million,
$93.3 million and $82.4 million for 2007, 2006 and 2005,
respectively. The increase in amounts recorded gross in revenues during
2007 reflected significant growth in the billed revenues upon which the
taxes are based as well as an increase in the safe harbor factor
prescribed by the Federal Communications Commission ("FCC") that is
used to determine the portion of billed revenues that is subject to the
federal universal service fund charge.
Advertising Costs
TDS
expenses advertising costs as incurred. Advertising expense totaled
$240.3 million, $224.9 million and $212.0 million in
2007, 2006 and 2005, respectively.
Income Taxes
TDS
files a consolidated federal income tax return. Deferred taxes are
computed using the liability method, whereby deferred tax assets are
recognized for future deductible temporary differences and operating
loss carryforwards, and deferred tax liabilities are recognized for
future taxable temporary differences. Both deferred tax assets and
liabilities are measured using the tax rates anticipated to be in
effect when the temporary differences reverse. Temporary differences
are the differences between the reported amounts of assets and
liabilities and their tax bases. Deferred tax assets and liabilities
are adjusted for the effects of changes in tax laws and rates on the
date of enactment. Deferred tax assets are reduced by a valuation
allowance when it is more likely than not that some portion or all of
the deferred tax assets will not be realized.
Effective
January 1, 2007, TDS adopted FASB Interpretation (FIN) 48, Accounting for Uncertainty in Income Taxes–an interpretation of FASB
Statement No. 109
("FIN 48"). FIN 48 clarifies the accounting for uncertainty
in income taxes recognized in an enterprise's financial statements in
accordance with SFAS No. 109, Accounting for Income Taxes.
Under FIN 48, TDS evaluates income tax uncertainties, assesses the
probability of the ultimate settlement with the applicable taxing
authority and records an amount based on that assessment. TDS had
previously set up tax accruals, as needed, to cover its potential
liability for income tax uncertainties pursuant to SFAS No. 5, Accounting for Contingencies ("SFAS 5").
Stock-Based Compensation
TDS
has established long-term incentive plans, employee stock purchase
plans, dividend reinvestment plans, and a non-employee director
compensation plan which are described more fully in
Note 22–Stock-Based Compensation. Prior to January 1, 2006,
TDS accounted for these plans under the recognition and measurement
provisions of Accounting Principles Board Opinion No. 25, Accounting for Stock Issued to Employees ("APB 25"), and related
interpretations, as permitted by SFAS No. 123, Accounting for Stock-Based Compensation
("SFAS 123"). Total stock-based employee compensation cost
recognized in the Consolidated Statements of Operations under
APB 25 was $8.1 million for the year ended December 31,
2005, primarily for restricted stock unit and deferred compensation
stock unit awards. No compensation cost was recognized in the
Consolidated Statements of Operations under APB 25 for stock
option awards for the year ended December 31, 2005, because all
outstanding options granted had an exercise price equal to the market
value of the underlying common stock on the date of grant. The employee
stock purchase plans and dividend reinvestment plans qualified as
non-compensatory plans under APB 25; therefore, no compensation
cost was recognized for these plans during the year ended
December 31, 2005.
Effective
January 1, 2006, TDS adopted the fair value recognition provisions of SFAS No. 123(R), Share-Based Payment
("SFAS 123(R)"), using the modified prospective transition method. Under the modified
prospective transition method, compensation costs recognized in 2006
and 2007 include: (a) compensation cost for all share-based
payments granted prior to but not yet vested as of January 1,
2006, based on the grant date fair value estimated in accordance with
the original provisions of SFAS 123, and (b) compensation
cost for all share-based payments granted subsequent to January 1,
2006, based on the grant-date fair value estimated in accordance with
the provisions of SFAS 123(R). Results for prior periods have not
been restated.
Under
SFAS 123(R), the long-term incentive plans and the employee stock
purchase plans are considered compensatory plans; therefore,
recognition of compensation costs for grants made under these plans is
required. Under SFAS 123(R), the dividend reinvestment plans are
not considered compensatory plans, therefore recognition of
compensation costs for grants made under these plans is not required.
Upon
adoption of SFAS 123(R), TDS elected to continue to value its
share-based payment transactions using a Black-Scholes valuation model,
which it previously used for purposes of preparing the pro forma
disclosures under SFAS 123. Under the provisions of
SFAS 123(R), stock-based compensation cost recognized during the
period is based on the portion of the share-based payment awards that
is ultimately expected to vest. Accordingly, stock-based compensation
cost recognized in 2006 and 2007 has been reduced for estimated
forfeitures. SFAS 123(R) requires forfeitures to be estimated at
the time of grant and revised, if necessary, in subsequent periods if
actual forfeitures differ from those estimates. Pre-vesting forfeitures
were estimated based on historical experience related to similar
awards, giving consideration to the contractual terms of the
stock-based awards, vesting schedules and expectations of future
employee behavior. In TDS' pro forma information required under
SFAS 123, TDS also reduced stock-based compensation cost for
estimated forfeitures. The expected life assumption was determined
based on TDS' historical experience. The expected volatility assumption
was based on the historical volatility of TDS' common stock. The
dividend yield was included in the assumptions. The risk-free interest
rate assumption was determined using the implied yield currently
available for zero-coupon U.S. government issues with a remaining term
that is commensurate with the expected life of the stock options.
Compensation
cost for stock option awards granted after January 1, 2006 is
recognized over the respective requisite service period of the awards,
which is generally the vesting period, on a straight-line basis over
the requisite service period for each separate vesting portion of the
awards as if the awards were, in-substance, multiple awards (graded
vesting attribution method). This same attribution method was used by
TDS for purposes of its pro forma disclosures under SFAS 123.
Certain
employees were eligible for retirement at the time that compensatory
stock options and restricted stock units were granted to them. Under
the terms of the TDS option agreements, options granted to these
individuals do not vest upon retirement. Under the terms of the
U.S. Cellular stock option and restricted stock unit agreements,
stock options and restricted stock units granted to retirement-eligible
employees will vest fully upon their retirement if the employees have
reached the age of 65. Similarly, under the terms of TDS' restricted
stock unit agreements, restricted stock units vest upon retirement if
the employee has reached the age of 66. Prior to the adoption of
SFAS 123(R), TDS used the "nominal vesting method" to recognize
the pro forma stock-based compensation cost related to stock options
and restricted stock units awarded to retirement-eligible employees.
This method does not take into account the effect of early vesting due
to the retirement of eligible employees. Upon adoption of
SFAS 123(R), TDS and U.S. Cellular adopted the
"non-substantive vesting method", which requires accelerated
recognition of the entire cost of stock options and restricted stock
units granted to retirement-eligible employees over the period of time
from the date of grant to the date the employee reaches age 65 (or age
66 for TDS employees with granted restricted stock units). If the
non-substantive vesting
method had been applied in prior periods, the effect on previously
disclosed pro forma stock-based compensation cost would not have been
material.
On
March 7, 2006, the TDS Compensation Committee approved amendments
to stock option award agreements. The amendments modify current and
future options to extend the exercise period until 30 days
following (i) the lifting of a "suspension" if options otherwise
would expire or be forfeited during the suspension period and
(ii) the lifting of a blackout if options otherwise would expire
or be forfeited during a blackout period. TDS temporarily suspended
issuances of shares under the 2004 Long Term Incentive Plan between
March 17, 2006 and October 10, 2006 as a consequence of late
SEC filings. TDS became current with its periodic SEC filings upon the
filing of its Form 10-Q for the quarter ended June 30, 2006,
on October 10, 2006. As required under the provisions of
SFAS 123(R), TDS evaluated the impact of this plan modification
and recognized stock-based compensation expense of $1.7 million in
2006.
Operating Leases
TDS,
U.S. Cellular and TDS Telecom are parties to various lease
agreements for office space, retail sites, cell sites and equipment
that are accounted for as operating leases. Certain leases have renewal
options and/or fixed rental increases. Renewal options that are
reasonably assured of exercise are included in determining the lease
term. TDS accounts for certain operating leases that contain rent
abatements, lease incentives and/or fixed rental increases by
recognizing lease revenue and expense on a straight-line basis over the
lease term in accordance with SFAS 13 and related pronouncements.
Recent Accounting Pronouncements
In September 2006, the FASB issued SFAS No. 157, Fair Value Measurements
("SFAS 157"). SFAS 157 defines fair value as used in numerous
accounting pronouncements, establishes a framework for measuring fair
value in U.S. GAAP, and expands disclosures related to the use of
fair value measures in financial statements. SFAS 157 does not
expand the use of fair value measurements in financial statements, but
standardizes its definition and guidance in U.S. GAAP.
SFAS 157 emphasizes that fair value is a market-based measurement
and not an entity-specific measurement, based on an exchange
transaction in which the entity sells an asset or transfers a liability
(exit price). SFAS 157 establishes a fair value hierarchy from
observable market data as the highest level to an entity's own fair
value assumptions about market participant assumptions as the lowest
level. In February 2008, the FASB issued FASB Staff Position ("FSP")
FAS 157-1 to exclude leasing transactions from the scope of
SFAS 157. In February 2008, the FASB also issued FSP
FAS 157-2 to defer the effective date of SFAS 157 for all
nonfinancial assets and liabilities, except those items recognized or
disclosed at fair value on an annual or more frequently recurring
basis, until years beginning after November 15, 2008. TDS adopted
SFAS 157 for its financial assets and liabilities effective
January 1, 2008 and does not anticipate any material impact on its
financial position or results of operations. TDS has not yet adopted
SFAS 157 for its nonfinancial assets and liabilities. TDS is
currently reviewing the adoption requirements related to its
nonfinancial assets and liabilities and has not yet determined the
impact, if any, on its financial position or results of operations.
In
September 2006, the FASB ratified EITF No. 06-1, Accounting for Consideration Given by a Service Provider to Manufacturers or Resellers of
Equipment Necessary for an End-Customer to Receive Service from the Service Provider ("EITF 06-1"). This guidance requires the application of
EITF 01-9, Accounting for Consideration Given by a Vendor to a Customer
("EITF 01-9"), when consideration is given to a reseller or
manufacturer to benefit the service provider's end customer.
EITF 01-9 requires that the consideration given be recorded as a
liability at the time of the sale of the equipment and also< provides
guidance for the classification of the expense. TDS adopted
EITF 06-1 effective January 1, 2008 with no material impact
on its financial position or results of operations.
In
February 2007, the FASB issued SFAS No. 159, The Fair Value Option for Financial Assets and Financial Liabilities, Including an Amendment of FASB
Statement No. 115
("SFAS 159"). SFAS 159 permits entities to choose to measure
many financial instruments and certain other items at fair value at
specified election dates. Unrealized gains and losses on items for
which the fair value option has been elected shall be reported in
earnings at each subsequent reporting date. SFAS 159 also
establishes presentation and disclosure requirements designed to
facilitate comparisons between entities that choose different
measurement attributes for similar types of assets and liabilities. TDS
adopted SFAS 159 on January 1, 2008 and is electing the fair
value option for its Deutsche Telekom marketable equity securities and
related derivative liabilities. As a result of the election, TDS
anticipates recognizing a $502.7 million cumulative-effect gain
adjustment to retained earnings (net of $291.2 million of tax) in
the first quarter of 2008.
In
December 2007, the FASB issued SFAS No. 141 (revised 2007), Business Combinations–a replacement of FASB Statement
No. 141 ("SFAS 141(R)"). SFAS 141(R) replaces FASB Statement No. 141, Business Combinations
("SFAS 141"). SFAS 141(R) retains the underlying concept of
SFAS 141 in that all business combinations are still required to
be accounted for at fair value under the acquisition method, a method
that requires the acquirer to measure and recognize the acquiree on an
entire entity basis and recognize the assets acquired and liabilities
assumed at their fair values as of the date of acquisition. However,
SFAS 141(R) changes the method of applying the acquisition method
in a number of significant aspects. SFAS 141(R) is effective on a
prospective basis for all business combinations for which the
acquisition date is on or after January 1, 2009, with the
exception of the accounting for valuation allowances on deferred taxes
and acquired tax contingencies. SFAS 141(R) amends SFAS
No. 109, Accounting for Income Taxes,
such that amendments made to valuation allowances on deferred taxes and
acquired tax contingencies associated with acquisitions that closed
prior to the effective date of SFAS 141(R) would also apply the
provisions of SFAS 141(R). TDS is currently reviewing the
requirements of SFAS 141(R) and has not yet determined the impact,
if any, on its financial position or results of operations.
In
December 2007, the FASB issued SFAS No.160, Consolidated Financial Statements, Including Accounting and Reporting of Noncontrolling Interests in
Subsidiaries–a replacement of ARB No. 51 ("SFAS 160"). SFAS 160 amends Accounting Research Bulletin No. 51, Consolidated Financial Statements, as amended
by FASB Statement No. 94, Consolidation of All Majority-Owned
Subsidiaries,
to establish new standards that will govern the accounting and
reporting of (1) noncontrolling interests (commonly referred to as
minority interests) in partially owned consolidated subsidiaries and
(2) the loss of control of subsidiaries. It also establishes that
once control of a subsidiary is obtained, changes in ownership
interests in that subsidiary that do not result in a loss of control
shall be accounted for as equity transactions, not as step
acquisitions. SFAS 160 is effective on a prospective basis for
TDS' 2009 financial statements, except for the presentation and
disclosure requirements, which will be applied retrospectively. TDS is
currently reviewing the requirements of SFAS 160 and has not yet
determined the impact on its financial position or results of
operations.
NOTE 2 GAIN (LOSS) ON INVESTMENTS
The
following table summarizes the components of Gain (loss) on investments
included in Investment and Other Income (Expense) in the Consolidated
Statements of Operations:
Year Ended December 31,
|
|
2007 |
|
2006 |
|
2005 |
|
| (Dollars in thousands) |
|
|
|
| Gain on sale of investments in unconsolidated entities |
|
$ |
6,301 |
|
$ |
161,846 |
|
$ |
500 |
|
| Impairment of investments in unconsolidated entities |
|
|
– |
|
|
– |
|
|
(6,754 |
) |
| Gain on settlement of variable prepaid forward contracts and sale of remaining shares |
|
|
426,692 |
|
|
– |
|
|
– |
|
| |
|
$ |
432,993 |
|
$ |
161,846 |
|
$ |
(6,254 |
) |
During
2007, the gain on sale of investments of forward contracts and
remaining shares related to the following:
- The
settlement of VeriSign variable prepaid forward contracts and the
disposition of remaining VeriSign Common Shares ($6.2 million).
- The
settlement of Vodafone variable prepaid forward contracts and the
disposition of remaining Vodafone American Depositary Receipts ("ADRs")
($171.6 million).
- The
settlement of certain Deutsche Telekom variable prepaid forward
contracts and the disposition of the remaining Deutsche Telekom
ordinary shares related to such contracts ($248.9 million).
See
Note 10–Marketable Equity Securities, and Note 15–Long-term
Debt and Forward Contracts, for additional information on these
marketable equity securities and variable prepaid forward contracts.
On
October 3, 2006, U.S. Cellular completed the sale of its
interest in Midwest Wireless Communications, LLC ("Midwest
Wireless") and recorded a gain of $70.4 million in 2006. An
additional gain of $6.3 million was recorded in 2007 in connection
with the release of certain proceeds held in escrow at the time of
sale. See Note 7–Acquisitions, Divestitures and Exchanges, for
more information on the disposition of Midwest Wireless.
TDS Telecom
has in the past obtained financing from the Rural Telephone Bank
("RTB"). In connection with such financings, TDS Telecom purchased
stock in the RTB. TDS Telecom has repaid all of its debt to the
RTB, but continued to own the RTB stock. In August 2005, the board of
directors of the RTB approved resolutions to liquidate and dissolve the
RTB. In order to effect the dissolution and liquidation, shareholders
were asked to remit their shares to receive cash compensation for those
shares. TDS Telecom remitted its shares and received
$101.7 million from the RTB and recorded a gain of
$90.3 million in 2006.
In
2005, TDS finalized the working capital adjustment related to the sale
of certain wireless interests to ALLTEL Corporation ("ALLTEL") on
November 30, 2004. The working capital adjustment increased the
total gain on investment from this transaction by $0.5 million.
Also in 2005, U.S. Cellular reduced the carrying value of one of
its equity method investments by $6.8 million to its underlying
fair value based on a cash flow analysis.
NOTE 3 GAIN ON SALE OF ACCOUNTS RECEIVABLE
In
December 2006, U.S. Cellular entered into an agreement to sell
$226.0 million face amount of accounts receivable written off in
previous periods; the proceeds from the sale were $5.9 million.
The agreement transferred all rights, title, and interest in the
account balances, along with the right to collect all amounts due, to
the buyer. The sale was subject to a 180-day period in which the buyer
was entitled to request a refund for any unenforceable accounts. The
transaction was recognized as a sale during the fourth quarter of 2006
in accordance with the provisions of SFAS No. 140, Accounting for Transfers and Servicing of Financial Assets and Extinguishments of
Liabilities,
with the gain deferred until expiration of the recourse period. During
the second quarter of 2007, U.S. Cellular recognized a gain of
$5.0 million, net of refunds for unenforceable accounts. The gain
is included in Selling, general and administrative expense in the
Consolidated Statements of Operations. All expenses related to the
transaction were recognized in the period incurred.
NOTE 4 INCOME TAXES
Income
tax expense charged to Income from Continuing Operations Before Income
Taxes and Minority Interest is summarized as follows:
Year Ended December 31,
|
|
2007 |
|
2006 |
|
2005 |
(Dollars in thousands)
|
|
|
| Current |
|
|
|
|
|
|
|
|
|
| |
Federal |
|
$ |
500,638 |
|
$ |
269,331 |
|
$ |
129,492 |
| |
State |
|
|
32,190 |
|
|
24,080 |
|
|
12,890 |
| |
Foreign |
|
|
19,273 |
|
|
18,048 |
|
|
15,855 |
| Deferred |
|
|
|
|
|
|
|
|
|
| |
Federal |
|
|
(267,348 |
) |
|
(163,938 |
) |
|
229,864 |
| |
State |
|
|
(15,699 |
) |
|
(31,062 |
) |
|
35,084 |
| Total income tax expense from continuing operations |
|
$ |
269,054 |
|
$ |
116,459 |
|
$ |
423,185 |
A
reconciliation of TDS' income tax expense from continuing operations
computed at the statutory rate to the reported income tax expense from
continuing operations, and the statutory federal income tax expense
rate to TDS' effective income tax expense rate from continuing
operations, is as follows:
Year Ended December 31,
|
|
2007 |
|
2006 |
|
2005 |
|
|
|
Amount |
|
Rate |
|
Amount |
|
Rate |
|
Amount |
|
Rate |
|
| (Dollars in thousands) |
|
|
|
| Statutory federal income tax expense |
|
$ |
239.9 |
|
35.0 |
% |
$ |
113.2 |
|
35.0 |
% |
$ |
387.5 |
|
35.0 |
% |
| State income taxes, net of federal benefit(1) |
|
|
10.6 |
|
1.6 |
|
|
(5.3 |
) |
(1.6 |
) |
|
33.7 |
|
3.0 |
|
| Minority share of income not included in consolidated tax return(2) |
|
|
3.0 |
|
0.5 |
|
|
(3.1 |
) |
(1.0 |
) |
|
(2.3 |
) |
(0.2 |
) |
| Gains (losses) on investments, sales of assets and impairments of assets |
|
|
– |
|
– |
|
|
0.1 |
|
– |
|
|
1.5 |
|
0.1 |
|
| Resolution of prior period tax issues |
|
|
1.5 |
|
0.2 |
|
|
(0.4 |
) |
(0.1 |
) |
|
(3.1 |
) |
(0.3 |
) |
| Foreign tax |
|
|
12.5 |
|
1.8 |
|
|
11.7 |
|
3.6 |
|
|
6.0 |
|
0.5 |
|
| Net research tax credit |
|
|
(0.4 |
) |
(0.1 |
) |
|
(0.2 |
) |
(0.1 |
) |
|
(0.5 |
) |
– |
|
| Other differences, net |
|
|
2.0 |
|
0.3 |
|
|
0.5 |
|
0.2 |
|
|
0.4 |
|
0.1 |
|
| Total income tax expense |
|
$ |
269.1 |
|
39.3 |
% |
$ |
116.5 |
|
36.0 |
% |
$ |
423.2 |
|
38.2 |
% |
During
2005, the Internal Revenue Service ("IRS") completed its audit of TDS'
federal income tax returns for the years 1997 through 2001 and TDS'
claims for research tax credits for the years 1995 through 2001.
Primarily based on the results of the audit, TDS reduced its accrual
for audit contingencies by $3.1 million (0.3 percentage
points) in 2005.
The
foreign tax incurred in 2007, 2006 and 2005 related to the dividend received from Deutsche Telekom.
Income
tax expense (benefit) charged to Net Income (Loss) is summarized as follows:
Year Ended December 31,
|
|
2007 |
|
2006 |
|
2005 |
(Dollars in thousands)
|
|
|
| Current |
|
|
|
|
|
|
|
|
|
| |
Federal |
|
$ |
500,638 |
|
$ |
269,331 |
|
$ |
129,492 |
| |
State |
|
|
32,190 |
|
|
24,080 |
|
|
12,890 |
| |
Foreign |
|
|
19,273 |
|
|
18,048 |
|
|
15,855 |
| Deferred |
|
|
|
|
|
|
|
|
|
| |
Federal |
|
|
(244,243 |
) |
|
(163,938 |
) |
|
230,391 |
| |
State |
|
|
(11,783 |
) |
|
(31,062 |
) |
|
35,113 |
| Total income tax expense |
|
$ |
296,075 |
|
$ |
116,459 |
|
$ |
423,741 |
The
pre-tax extraordinary gain from the discontinuance of SFAS 71 was
decreased by deferred income tax expense of $27.0 million in 2007.
Income from discontinued operations was decreased by deferred income
tax expense of $0.6 million in 2005.
TDS'
net current deferred income tax liability totaled $327.2 million
and $236.4 million at December 31, 2007 and 2006,
respectively. The 2007 and 2006 net current deferred income tax
liabilities primarily represents the deferred income taxes on the
current portion of marketable equity securities.
TDS'
noncurrent deferred income tax assets and liabilities at
December 31, 2007 and 2006 and the temporary differences that gave
rise to them are as follows:
December 31,
|
|
2007 |
|
2006 |
|
(Dollars in thousands)
|
|
|
|
| Deferred Tax Assets |
|
|
|
|
|
|
|
| |
Net operating loss carryforwards ("NOLs") |
|
$ |
82,809 |
|
$ |
78,399 |
|
| |
Derivative instruments |
|
|
– |
|
|
159,039 |
|
| |
Other |
|
|
89,824 |
|
|
54,324 |
|
| |
|
|
172,633 |
|
|
291,762 |
|
| |
Less valuation allowance |
|
|
(74,867 |
) |
|
(49,506 |
) |
| Total Deferred Tax Assets |
|
|
97,766 |
|
|
242,256 |
|
Deferred Tax Liabilities |
|
|
|
|
|
|
|
| |
Marketable equity securities |
|
|
– |
|
|
547,628 |
|
| |
Property, plant and equipment |
|
|
309,009 |
|
|
336,213 |
|
| |
Partnership investments |
|
|
85,939 |
|
|
103,576 |
|
| |
Licenses |
|
|
243,382 |
|
|
205,187 |
|
| |
Other |
|
|
15,029 |
|
|
– |
|
| Total Deferred Tax Liabilities |
|
|
653,359 |
|
|
1,192,604 |
|
| |
Net Deferred Income Tax Liability |
|
$ |
555,593 |
|
$ |
950,348 |
|
At
December 31, 2007, TDS and certain subsidiaries had
$1,443 million of state NOL carryforwards (generating a
$78.2 million deferred tax asset) available to offset future
taxable income primarily of the individual subsidiaries that generated
the losses. The state NOL carryforwards expire between 2008 and 2027.
Certain subsidiaries that are not included in the federal consolidated
income tax return, but file separate federal tax returns, had federal
NOL carryforwards (generating a $4.6 million deferred tax asset)
available to offset future taxable income. The federal NOL
carryforwards expire between 2008 and 2027. A valuation allowance was
established for certain state NOL carryforwards and the federal NOL
carryforwards since it is more than likely that a portion of such
carryforwards will expire before they can be utilized.
During
2007, TDS reduced the valuation allowance on its deferred tax asset by
$12.0 million, which resulted in a deferred tax benefit of the
same amount. This valuation allowance related to state income tax NOL
carryforwards of certain TDS subsidiaries for which TDS previously
believed it was more than likely that they would not be realized prior
to the expiration of such carryforwards. However, these subsidiaries
have experienced increases in both income before income taxes in recent
years, and expected taxable income in future years. As a result, during
2007 TDS estimated that a portion of these NOL carryforwards previously
assessed as not likely of realization, were more than likely
realizable, and reduced its valuation allowance accordingly.
Effective
January 1, 2007, TDS adopted FIN 48. In accordance with
FIN 48, TDS recognized a cumulative effect adjustment of
$4.4 million, decreasing its liability for unrecognized tax
benefits, interest, and penalties and increasing the January 1,
2007 balance of Common stockholders' equity. Of this amount,
$20.7 million increased Accumulated other comprehensive income and
$16.3 million represents the cumulative reduction of beginning
retained earnings.
At
January 1, 2007, TDS had $28.4 million in unrecognized tax
benefits, which, if recognized, would reduce income tax expense by
$14.3 million, net of the federal benefit from state income taxes.
At December 31, 2007, TDS had $42.1 million in unrecognized
tax benefits, which, if recognized, would reduce income tax expense by
$22.0 million, net of the federal benefit from state income taxes.
A
reconciliation of the beginning and ending amount of unrecognized tax benefits is as follows:
(Dollars in thousands)
|
|
|
|
| Balance at January 1, 2007 |
|
$ |
28,430 |
|
| |
Additions for tax positions of current year |
|
|
6,389 |
|
| |
Additions for tax positions of prior years |
|
|
8,696 |
|
| |
Reductions for tax positions of prior years |
|
|
(928 |
) |
| |
Reductions for settlements of tax positions |
|
|
(192 |
) |
| |
Reductions for lapses in statutes of limitations |
|
|
(266 |
) |
| Balance at December 31, 2007 |
|
$ |
42,129 |
|
Unrecognized
tax benefits are included in Accrued taxes and Other deferred
liabilities and credits in the December 31, 2007 Balance Sheet.
As
of December 31, 2007, TDS believes it is reasonably possible that
unrecognized tax benefits could change in the next twelve months. The
nature of the uncertainty relates to the exclusion of certain
transactions from state income taxes due primarily to anticipated
closure of state income tax audits and the expiration of statutes of
limitation. It is anticipated that these events could reduce
unrecognized tax benefits in the range of $0.7 million to
$3.2 million.
TDS
recognizes accrued interest and penalties related to unrecognized tax
benefits in income tax expense. This amount totaled $2.8 million
for the year ended December 31, 2007. Net accrued interest and
penalties were $1.3 million and $4.1 million at
January 1, 2007 and December 31, 2007, respectively.
TDS
and its subsidiaries file federal and state income tax returns. With
few exceptions, TDS is no longer subject to federal, state and local
income tax examinations by tax authorities for years prior to 2002.
TDS' consolidated federal income tax returns for the years
2002 - 2005 are currently under examination by the Internal
Revenue Service. Also, certain of TDS' state income tax returns are
under examination by various state taxing authorities.
NOTE 5 EXTRAORDINARY
ITEM–DISCONTINUANCE OF THE APPLICATION OF STATEMENT OF FINANCIAL
ACCOUNTING STANDARDS NO. 71, ACCOUNTING FOR THE EFFECTS OF CERTAIN
TYPES OF REGULATION
Historically,
TDS Telecom's ILEC operations followed the accounting for
regulated enterprises prescribed by SFAS 71. This accounting
recognizes the economic effects of rate-making actions of regulatory
bodies in the financial statements of the TDS Telecom ILEC
operations.
TDS Telecom
has regularly monitored the appropriateness of the application of
SFAS 71. Recent changes in TDS Telecom's business environment
have caused competitive forces to surpass regulatory forces such that
TDS Telecom has concluded that it is no longer reasonable to
assume that rates set at levels that will recover the enterprise's cost
can be charged to its customers.
TDS Telecom
has experienced increasing access line losses due to increasing levels
of competition across all of the ILEC service areas. Competition has
intensified in 2007 from cable and wireless operators who have extended
their investment beyond major markets to enable a broader range of
voice and data services that compete directly with TDS Telecom's
service offerings. These alternative telecommunications providers have
transformed a pricing structure historically based on the recovery of
costs to a pricing structure based on market conditions. Consequently,
TDS Telecom has had to alter its strategy to compete in its
markets. Specifically, in the third quarter of 2007, TDS Telecom
initiated an aggressive program of service bundling and deep
discounting and has made the decision to voluntarily exit certain
revenue pools administered by the FCC-supervised National Exchange
Carrier Association in order to achieve additional pricing flexibility
to meet competitive pressures.
Based
on these material factors impacting its operations, management
determined in the third quarter of 2007 that it was no longer
appropriate to continue the application of SFAS 71 for reporting
its financial results. Accordingly, TDS Telecom recorded a
non-cash extraordinary gain of $42.8 million, net of taxes of
$27.0 million, upon discontinuance of the provisions of
SFAS 71, as required by the provisions of SFAS No. 101, Regulated Enterprises–Accounting for the
Discontinuation of the Application of FASB Statement No. 71 ("SFAS 101"). The components of the non-cash extraordinary gain are as follows:
|
|
Before Tax Effects |
|
After Tax Effects |
|
| (in thousands) |
|
|
|
| Write-off of regulatory cost of removal liability |
|
$ |
70,107 |
|
$ |
43,018 |
|
| Write-off of other net regulatory assets |
|
|
(259 |
) |
|
(191 |
) |
| Total |
|
$ |
69,848 |
|
$ |
42,827 |
|
In
conjunction with the discontinuance of SFAS 71, TDS Telecom
has assessed the useful lives of fixed assets and determined that the
impacts of any changes were not material.
NOTE 6 EARNINGS PER SHARE
Basic
earnings per share is computed by dividing net income (loss) available
to common by the weighted average number of common shares outstanding
during the period. Diluted earnings per share is computed by dividing
net income available to common by the weighted average common shares
adjusted to include the effect of potentially dilutive securities.
Potentially dilutive securities include incremental shares issuable
upon exercise of outstanding stock options, the vesting of restricted
stock units and the potential conversion of preferred stock to Common
and Special Common shares.
The
amounts used in computing earnings per share and the effect of
potentially dilutive securities on income and the weighted average
number of Common, Special Common and Series A Common Shares are as
follows:
Year Ended December 31,
|
|
2007 |
|
2006 |
|
2005 |
|
(Dollars in thousands)
|
|
|
|
| Basic Earnings per Share |
|
|
|
|
|
|
|
|
|
|
| |
Income from continuing operations |
|
$ |
343,285 |
|
$ |
161,759 |
|
$ |
646,743 |
|
| |
Preferred dividend requirement |
|
|
(52 |
) |
|
(165 |
) |
|
(202 |
) |
| |
Income from continuing operations available to common |
|
|
343,233 |
|
|
161,594 |
|
|
646,541 |
|
| |
Discontinued operations, net of tax |
|
|
– |
|
|
– |
|
|
997 |
|
| |
Extraordinary item, net of tax |
|
|
42,827 |
|
|
– |
|
|
– |
|
| |
Net income available to common used in basic earnings per share |
|
$ |
386,060 |
|
$ |
161,594 |
|
$ |
647,538 |
|
Year Ended December 31, |
|
2007 |
|
2006 |
|
2005 |
|
(Dollars in thousands)
|
|
|
|
| Diluted Earnings per Share |
|
|
|
|
|
|
|
|
|
|
| |
Income from continuing operations available to common used in basic earnings per share |
|
$ |
343,233 |
|
$ |
161,594 |
|
$ |
646,541 |
|
| |
Minority income adjustment(1) |
|
|
(2,155 |
) |
|
(1,255 |
) |
|
(999 |
) |
| |
Preferred dividend adjustment(2) |
|
|
49 |
|
|
49 |
|
|
199 |
|
| |
Income from continuing operations available to common |
|
|
341,127 |
|
|
160,388 |
|
|
645,741 |
|
| |
Discontinued operations, net of tax |
|
|
– |
|
|
– |
|
|
997 |
|
| |
Extraordinary item, net of tax |
|
|
42,827 |
|
|
– |
|
|
– |
|
| |
Net income available to common used in diluted earnings per share |
|
$ |
383,954 |
|
$ |
160,388 |
|
$ |
646,738 |
|
Year Ended December 31,
|
|
2007 |
|
2006 |
|
2005 |
| (Shares in thousands) |
|
|
| Weighted average number of shares used in basic earnings per share Common Shares |
|
52,518 |
|
51,552 |
|
51,227 |
| |
Special Common Shares |
|
58,660 |
|
57,905 |
|
57,636 |
| |
Series A Common Shares |
|
6,446 |
|
6,447 |
|
6,433 |
| |
|
Total |
|
117,624 |
|
115,904 |
|
115,296 |
| Effects of dilutive securities: |
|
|
|
|
|
|
| |
Effects of preferred shares(1) |
|
47 |
|
45 |
|
158 |
| |
Effects of stock options(2) |
|
1,287 |
|
886 |
|
520 |
| |
Effects of restricted stock units(3) |
|
168 |
|
9 |
|
107 |
| Weighted average number of shares of Common Stock used in diluted earnings per share |
|
119,126 |
|
116,844 |
|
116,081 |
Year Ended December 31,
|
|
2007 |
|
2006 |
|
2005 |
| Basic Earnings per Share |
|
|
|
|
|
|
|
|
|
| |
Continuing operations |
|
$ |
2.92 |
|
$ |
1.39 |
|
$ |
5.61 |
| |
Discontinued operations, net of tax |
|
|
– |
|
|
– |
|
|
0.01 |
| |
Extraordinary item, net of tax |
|
|
0.36 |
|
|
– |
|
|
– |
| |
|
$ |
3.28 |
|
$ |
1.39 |
|
$ |
5.62 |
Year Ended December 31,
|
|
2007 |
|
2006 |
|
2005 |
| Diluted Earnings per Share |
|
|
|
|
|
|
|
|
|
| |
Continuing operations |
|
$ |
2.86 |
|
$ |
1.37 |
|
$ |
5.56 |
| |
Discontinued operations, net of tax |
|
|
– |
|
|
– |
|
|
0.01 |
| |
Extraordinary item, net of tax |
|
|
0.36 |
|
|
– |
|
|
– |
| |
|
$ |
3.22 |
|
$ |
1.37 |
|
$ |
5.57 |
NOTE 7 ACQUISITIONS, DIVESTITURES AND EXCHANGES
TDS
assesses its existing wireless and wireline interests on an ongoing
basis with a goal of improving the competitiveness of its operations
and maximizing its long-term return on investment. As part of this
strategy, TDS reviews attractive opportunities to acquire additional
operating markets, telecommunications companies and wireless spectrum.
In addition, TDS may seek to divest outright or include in exchanges
for other wireless interests those markets and wireless interests that
are not strategic to its long-term success.
2007 Activity
Transactions Pending as of December 31, 2007:
On
December 3, 2007, U.S. Cellular entered into an agreement to
acquire six 12 megahertz C block lower 700 megahertz
licenses in Maine for $5.0 million in cash. This transaction is
expected to close in 2008.
On
November 30, 2007, TDS Telecom entered into an agreement to
acquire an ILEC serving 750 equivalent access lines for
$6.6 million, subject to a working capital adjustment. The
transaction closed in February 2008.
On
November 30, 2007, U.S. Cellular entered into an exchange
agreement with Sprint Nextel which calls for U.S. Cellular to
receive personal communication service ("PCS") spectrum in eight
licenses covering portions of four states (Oklahoma, West Virginia,
Maryland and Iowa), and in exchange for U.S. Cellular to deliver
PCS spectrum in eight licenses covering portions of Illinois. The
exchange of licenses will provide U.S. Cellular with additional
spectrum to meet anticipated future capacity and coverage requirements
in several of its key markets. Six of the licenses which
U.S. Cellular will receive will add spectrum in areas where
U.S. Cellular currently provides service and two of the licenses
are in areas that will provide incremental population of approximately
88,000. The eight licenses which U.S. Cellular will deliver are in
areas where U.S. Cellular currently provides service and has what
it considers an excess of spectrum (i.e., it has more spectrum
than is expected to be needed to continue to provide high quality
service). No cash, customers, network assets or other assets or
liabilities will be included in the exchange, which is expected to be
completed during the first half of 2008. As a result of this exchange
transaction, TDS recognized a pre-tax loss on exchange of assets of
$20.8 million during 2007.
Transactions Completed as of December 31, 2007:
On
December 3, 2007, U.S. Cellular acquired a 12 megahertz
C block lower 700 megahertz license in Kansas for
$3.2 million in cash.
On
February 1, 2007, U.S. Cellular purchased 100% of the
membership interests of Iowa 15 Wireless, LLC
("Iowa 15") and obtained the 25 megahertz FCC cellular
license to provide wireless service in Iowa Rural Service Area ("RSA")
15 for approximately $18.3 million in cash. This acquisition
increased investments in licenses, goodwill and customer lists by
$7.9 million, $5.9 million and $1.6 million,
respectively. The goodwill of $5.9 million is deductible for
income tax purposes.
In
addition, in 2007, TDS Telecom and Suttle Straus each acquired a
company for cash, which purchases aggregated $2.3 million. These
acquisitions increased goodwill by $1.8 million of which
$1.0 million is deductible for income tax purposes.
In
aggregate, the 2007 acquisitions, divestitures and exchanges increased
licenses by $11.1 million, goodwill by $7.7 million and
customer lists by $1.6 million. Such amounts exclude the impact of
the step acquisitions that resulted from U.S. Cellular's
repurchase of its Common Shares. See Note 8–Licenses and Goodwill,
and Note 9–Customer Lists, for the impact of such repurchases.
2006 Activity
U.S. Cellular
is a limited partner in Barat Wireless, L.P. ("Barat Wireless"),
an entity which participated in the auction of wireless spectrum
designated by the FCC as Auction 66. Barat Wireless was qualified
to receive a 25% bid credit available to "very small businesses",
defined as businesses having annual gross revenues of less than
$15 million. At the conclusion of the auction on
September 18, 2006, Barat Wireless was the successful bidder with
respect to 17 licenses for which it had bid $127.1 million,
net of its bid credit. On April 30, 2007, the FCC granted Barat
Wireless' applications with respect to the 17 licenses for which
it was the successful bidder. These 17 license areas cover portions of
20 states and are in markets which are either adjacent to or
overlap current U.S. Cellular licensed areas.
Barat
Wireless is in the process of developing its long-term business and
financing plans. As of December 31, 2007, U.S. Cellular had
made capital contributions and advances to Barat Wireless and/or its
general partner of $127.2 million, which are included in Licenses
in the Consolidated Balance Sheets. Barat Wireless used the funding to
pay the FCC an initial deposit of $79.9 million on July 14,
2006 to allow it to participate in Auction 66. On October 18,
2006, Barat Wireless paid the balance due at the conclusion of the
auction for the licenses with respect to which Barat Wireless was the
successful bidder; such amount totaled $47.2 million. For
financial statement purposes, U.S. Cellular consolidates Barat
Wireless and Barat Wireless, Inc., the general partner of Barat
Wireless, pursuant to the guidelines of FASB Interpretation
No. 46(R), Consolidation of Variable Interest Entities,
an interpretation of ARB No. 51, ("FIN 46(R)"), as
U.S. Cellular anticipates benefiting from or absorbing a majority
of Barat Wireless' expected gains or losses. Pending finalization of
Barat Wireless' permanent financing plan, and upon request by Barat
Wireless, U.S. Cellular may agree to make additional capital
contributions and advances to Barat Wireless and/or its general
partner.
In
October 2006, U.S. Cellular's interest in Midwest Wireless
Communications, LLC ("Midwest Wireless") was sold to ALLTEL
Corporation. In connection with the sale, U.S. Cellular became
entitled to receive approximately $106.0 million in cash with
respect to its interest in Midwest Wireless. Of this amount,
$95.1 million was distributed upon closing and $10.9 million
was held in escrow to secure certain true-up, indemnification and other
possible adjustments; the funds held in escrow were to be distributed
in installments over a period of four to fifteen months following the
closing. During 2007, U.S. Cellular received $4.0 million of
funds that were distributed from the escrow, plus interest of
$0.3 million. On January 8, 2008, U.S. Cellular received
a final distribution from the escrow of $6.3 million, plus
interest of $0.5 million.
In
April 2006, U.S. Cellular purchased the remaining ownership
interest in a Tennessee wireless market, in which it had previously
owned a 16.7% interest, for approximately $18.9 million in cash.
This acquisition increased investments in licenses, goodwill and
customer lists by $5.5 million, $4.1 million and
$2.0 million, respectively. The $4.1 million of goodwill is
not deductible for income tax purposes.
In
aggregate, the 2006 acquisitions, divestitures and exchanges increased
licenses by $132.7 million, goodwill by $4.1 million and
customer lists by $2.0 million.
2005 Activity
On
December 19, 2005, U.S. Cellular completed an exchange of
certain wireless markets in Kansas, Nebraska and Idaho with a
subsidiary of ALLTEL. Under the agreement, U.S. Cellular acquired
fifteen Rural Service Area ("RSA") markets in Kansas and Nebraska with
a fair value of $166.5 million in exchange for two RSA markets in
Idaho with a net carrying value of $64.4 million and
$57.1 million in cash, as adjusted. U.S. Cellular also
capitalized $2.6 million of acquisition-related costs. In
connection with the exchange, U.S. Cellular recorded a pre-tax
gain of $44.7 million in 2005, which is included in< (Gain)
loss on asset disposals/exchanges in the Consolidated Statements of
Operations. This gain was reduced to $42.4 million at the TDS
consolidated level as TDS allocated additional U.S. Cellular step
acquisition goodwill of $2.3 million to the markets divested. The
gain represented the excess of the fair value of assets acquired and
liabilities assumed over the sum of cash and net carrying value of
assets and liabilities delivered in the exchange.
U.S. Cellular
is a limited partner in Carroll Wireless L.P. ("Carroll
Wireless"), an entity which participated in the auction of wireless
spectrum designated by the FCC as Auction 58. Carroll Wireless was
qualified to bid on "closed licenses" that were available only to
companies included under the FCC definition of "entrepreneurs," which
are small businesses that have a limited amount of assets and revenues.
In addition, Carroll Wireless bid on "open licenses" that were not
subject to restriction. With respect to these licenses, however,
Carroll Wireless was qualified to receive a 25% bid credit available to
"very small businesses" which were defined as businesses having average
annual gross revenues of less than $15 million. Carroll Wireless
was a successful bidder for 16 licenses in Auction 58, which
ended on February 15, 2005. The aggregate amount paid to the FCC
for the 16 licenses was $129.7 million, net of the bid credit
to which Carroll Wireless was entitled. These 16 licenses cover
portions of 10 states and are in markets which are either adjacent
to or overlap current U.S. Cellular licensed areas.
Carroll
Wireless is in the process of developing its long-term business and
financing plans. As of December 31, 2007, U.S. Cellular had
made capital contributions and advances to Carroll Wireless and/or its
general partner of approximately $129.9 million; of this amount,
$129.7 million is included in Licenses in the Consolidated Balance
Sheets. For financial statement purposes, U.S. Cellular
consolidates Carroll Wireless and Carroll PCS, Inc., the
general partner of Carroll Wireless, pursuant to the guidelines of
FIN 46(R), as U.S. Cellular anticipates benefiting from or
absorbing a majority of Carroll Wireless' expected gains or losses.
Pending finalization of Carroll Wireless' permanent financing plan, and
upon request by Carroll Wireless, U.S. Cellular may agree to make
additional capital contributions and advances to Carroll Wireless
and/or its general partner. U.S. Cellular has approved additional
funding of $1.4 million of which $0.1 million was provided to
Carroll Wireless as of December 31, 2007.
In
the first quarter of 2005, U.S. Cellular adjusted the previously
reported gain related to its sale to ALLTEL of certain wireless
properties on November 30, 2004. The adjustment of the gain, which
resulted from a working capital adjustment that was finalized in the
first quarter of 2005, increased the total gain on the sale by
$0.5 million.
In
addition, in 2005, U.S. Cellular purchased one new wireless market
and certain minority interests in other wireless markets in which it
already owned a controlling interest for $6.9 million in cash. As
a result of these acquisitions, U.S. Cellular's Licenses, Goodwill
and Customer lists were increased by $3.9 million,
$0.3 million and $1.2 million, respectively.
In
aggregate, the 2005 acquisitions, divestitures and exchanges increased
Licenses by $136.3 million, Goodwill by $28.2 million and
Customer lists by $32.7 million.
Pro Forma Operations
Assuming
the exchanges and acquisitions accounted for as purchases during the
period January 1, 2006 to December 31, 2007 had taken place
on January 1, 2006, unaudited pro forma results of operations
would have been as follows:
Year Ended December 31,
|
|
2007 |
|
2006 |
| (Unaudited, dollars in thousands, except per share amounts) |
|
|
| Operating revenues |
|
$ |
4,830,604 |
|
$ |
4,378,177 |
| Interest expense |
|
|
208,736 |
|
|
234,745 |
| Income (loss) from continuing operations |
|
|
342,941 |
|
|
158,028 |
| Net income (loss) |
|
|
385,767 |
|
|
158,028 |
| Earnings (loss) per share–basic |
|
$ |
3.28 |
|
$ |
1.36 |
| Earnings (loss) per share–diluted |
|
$ |
3.22 |
|
$ |
1.34 |
NOTE 8 LICENSES AND GOODWILL Changes
in TDS' licenses and goodwill are primarily the result of acquisitions,
divestitures and impairments of its licenses, wireless markets and
telephone companies. See Note 7–Acquisitions, Divestitures and
Exchanges for information regarding purchase and sale transactions
which affected licenses and goodwill. Changes in Licenses and Goodwill
in 2007 and 2006 were as follows:
Year Ended December 31,
|
|
2007 |
|
2006 |
|
(Dollars in thousands)
|
|
|
|
| Licenses |
|
|
|
|
|
|
|
| Consolidated Beginning Balance |
|
$ |
1,520,407 |
|
$ |
1,388,343 |
|
| U.S. Cellular |
|
|
|
|
|
|
|
| |
Balance, beginning of year |
|
|
1,494,327 |
|
|
1,362,263 |
|
| |
Acquisitions(1) |
|
|
11,096 |
|
|
132,674 |
|
| |
Loss on exchanges(2) |
|
|
(20,841 |
) |
|
– |
|
| |
Impairments(3) |
|
|
(2,136 |
) |
|
– |
|
| |
Other |
|
|
– |
|
|
(610 |
) |
| |
|
|
1,482,446 |
|
|
1,494,327 |
|
| |
TDS Licenses related to U.S. Cellular, beginning of year(4) |
|
|
23,280 |
|
|
23,280 |
|
| |
Step acquisition allocation adjustment(5) |
|
|
8,103 |
|
|
– |
|
| |
|
|
31,383 |
|
|
23,280 |
|
| |
|
Balance, end of year |
|
|
1,513,829 |
|
|
1,517,607 |
|
| TDS Telecom–CLEC |
|
|
|
|
|
|
|
| |
Balance, beginning of year |
|
|
2,800 |
|
|
2,800 |
|
| |
|
Balance, end of year |
|
|
2,800 |
|
|
2,800 |
|
| Net Change–Consolidated |
|
|
(3,778 |
) |
|
132,064 |
|
| Consolidated Ending Balance |
|
$ |
1,516,629 |
|
$ |
1,520,407 |
|
Year Ended December 31,
|
|
2007 |
|
2006 |
|
(Dollars in thousands)
|
|
|
|
| Goodwill |
|
|
|
|
|
|
|
| Consolidated Beginning Balance |
|
$ |
647,853 |
|
$ |
643,636 |
|
| U.S. Cellular |
|
|
|
|
|
|
|
| |
Balance, beginning of year |
|
|
485,452 |
|
|
481,235 |
|
| |
|
Acquisitions |
|
|
5,864 |
|
|
4,118 |
|
| |
|
Other |
|
|
– |
|
|
99 |
|
| |
|
|
491,316 |
|
|
485,452 |
|
| |
TDS Goodwill related to U.S. Cellular, beginning of year(1) |
|
|
(238,532 |
) |
|
(238,532 |
) |
| |
Step acquisition allocation adjustment(2) |
|
|
23,632 |
|
|
– |
|
| |
|
|
(214,900 |
) |
|
(238,532 |
) |
| |
Balance, end of year |
|
|
276,416 |
|
|
246,920 |
|
| TDS Telecom–ILEC |
|
|
|
|
|
|
|
| |
Balance, beginning of year |
|
|
398,652 |
|
|
398,652 |
|
| |
Acquisitions |
|
|
259 |
|
|
– |
|
| |
Balance, end of year |
|
|
398,911 |
|
|
398,652 |
|
| Other(3) |
|
|
|
|
|
|
|
| |
Balance, beginning of year |
|
|
2,281 |
|
|
2,281 |
|
| |
Acquisitions |
|
|
1,521 |
|
|
– |
|
| |
Balance, end of year |
|
|
3,802 |
|
|
2,281 |
|
| Net Change–Consolidated |
|
|
31,276 |
|
|
4,217 |
|
| Consolidated Ending Balance |
|
$ |
679,129 |
|
$ |
647,853 |
|
NOTE 9 CUSTOMER LISTS
Customer
lists, which are intangible assets resulting from acquisitions of
wireless markets or step acquisition allocation of value related to
U.S. Cellular's share buyback programs, are amortized based on
average customer retention periods using the double declining balance
method in the first year, switching to straight-line over the remaining
estimated life. Changes in Customer Lists in 2007 and 2006 were as
follows:
Year Ended December 31,
|
|
2007 |
|
2006 |
|
| (Dollars in thousands) |
|
|
|
| Balance, beginning of period |
|
$ |
26,196 |
|
$ |
47,649 |
|
| |
Acquisitions |
|
|
1,560 |
|
|
2,042 |
|
| |
Impairment(1) |
|
|
(1,947 |
) |
|
– |
|
| |
Amortization |
|
|
(14,133 |
) |
|
(23,495 |
) |
| |
Step acquisition allocation adjustment(2) |
|
|
14,175 |
|
|
– |
|
| Balance, end of period |
|
$ |
25,851 |
|
$ |
26,196 |
|
Based
on the balance of customer lists as of December 31, 2007,
amortization expense for the years 2008 - 2012 is expected to
be $10.8 million, $6.9 million, $5.4 million,
$2.4 million and $0.4 million, respectively.
NOTE 10 MARKETABLE EQUITY SECURITIES
Information
regarding TDS' marketable equity securities is summarized as follows:
December 31,
|
|
2007 |
|
2006 |
|
(Dollars in thousands)
|
|
|
|
| Marketable Equity Securities included in Current Assets |
|
|
|
|
|
|
|
| |
Deutsche Telekom AG–85,969,689 and 45,492,172 Ordinary Shares, respectively |
|
$ |
1,886,175 |
|
$ |
833,872 |
|
| |
Vodafone Group Plc–11,327,674 American Depositary Receipts in 2006 |
|
|
– |
|
|
314,683 |
|
| |
Rural Cellular Corporation–719,396 equivalent Common Shares in 2007 |
|
|
31,718 |
|
|
– |
|
| |
VeriSign, Inc.–2,361,333 Common Shares in 2006 |
|
|
– |
|
|
56,789 |
|
| Aggregate fair value included in Current Assets |
|
|
1,917,893 |
|
|
1,205,344 |
|
Marketable Equity Securities included in Investments |
|
|
|
|
|
|
|
| |
Deutsche Telekom AG–85,969,689 Ordinary Shares in 2006 |
|
|
– |
|
|
1,575,824 |
|
| |
Rural Cellular Corporation–719,396 equivalent Common Shares in 2006 |
|
|
– |
|
|
9,453 |
|
| |
Other |
|
|
1 |
|
|
9 |
|
| Aggregate fair value included in Investments |
|
|
1 |
|
|
1,585,286 |
|
| Total aggregate fair value |
|
|
1,917,894 |
|
|
2,790,630 |
|
| Accounting cost basis |
|
|
864,644 |
|
|
1,507,477 |
|
| Gross holding gains |
|
|
1,053,250 |
|
|
1,283,153 |
|
| Gross realized holding gains |
|
|
– |
|
|
(29,729 |
) |
| Gross unrealized holding gains |
|
|
1,053,250 |
|
|
1,253,424 |
|
| Equity method unrealized gains |
|
|
387 |
|
|
352 |
|
| Income tax expense |
|
|
(386,315 |
) |
|
(488,817 |
) |
| Minority share of unrealized holding gains |
|
|
(1,945 |
) |
|
(14,981 |
) |
| Unrealized holding gains, net of tax and minority share |
|
|
665,377 |
|
|
749,978 |
|
| Derivative instruments unrealized holding gains, net of tax and minority share |
|
|
(144,583 |
) |
|
(215,122 |
) |
| Retirement plans, net of tax |
|
|
(9,018 |
) |
|
(12,743 |
) |
| Amount included in Accumulated other comprehensive income |
|
$ |
511,776 |
|
$ |
522,113 |
|
TDS
and its subsidiaries hold marketable equity securities that are
publicly traded and can have volatile movements in share prices. TDS
and its subsidiaries do not make direct investments in publicly traded
companies and all of these interests were acquired as a result of
sales, trades or reorganizations of other assets.
The
investment in Deutsche Telekom AG ("Deutsche Telekom") resulted
from TDS' disposition of its over 80%-owned personal communication
services operating subsidiary, Aerial Communications, Inc., to
VoiceStream Wireless Corporation ("VoiceStream") in exchange for stock
of VoiceStream, which was then acquired by Deutsche Telekom in exchange
for Deutsche Telekom stock. The investment in Rural Cellular
Corporation ("RCCC") resulted from a consolidation of several cellular
partnerships in which TDS subsidiaries held interests in RCCC, and the
distribution of RCCC stock in exchange for these interests. The prior
investment in Vodafone resulted from certain dispositions of
non-strategic cellular investments to, or settlements with, AirTouch
Communications Inc. ("AirTouch"), in exchange for stock of
AirTouch, which was then acquired by Vodafone whereby TDS and its
subsidiaries received American Depositary Receipts representing
Vodafone stock. The prior investment in VeriSign, Inc.
("VeriSign") resulted from the acquisition by VeriSign of
Illuminet, Inc., a telecommunications entity in which several TDS
subsidiaries held interests.
At
an Extraordinary General Meeting held on July 25, 2006,
shareholders of Vodafone approved a Special Distribution of £0.15 per
share (£1.50 per ADR) and a Share Consolidation under which every 8
ADRs of Vodafone were consolidated into 7 ADRs. As a result of the
Special Distribution which was paid on August 18, 2006,
U.S. Cellular and TDS Telecom received approximately
$28.6 million and $7.6 million, respectively, in cash; this
amount, representing a return of capital for financial statement
purposes, was recorded as a reduction in the accounting cost basis of
marketable equity securities. Also, as a result of the Share
Consolidation which was effective on July 28, 2006,
U.S. Cellular's previous 10,245,370 Vodafone ADRs were
consolidated into 8,964,698 Vodafone ADRs and TDS Telecom's
previous 2,700,545 Vodafone ADRs were consolidated into 2,362,976 ADRs.
TDS
entered into a number of variable prepaid forward contracts ("forward
contracts") related to the marketable equity securities it holds. The
economic hedge risk management objective of the forward contracts is to
hedge the value of the marketable equity securities from losses due to
decreases in the market prices of the securities while retaining a
share of gains from increases in the market prices of such securities.
The downside risk is hedged at or above the accounting cost basis of
the securities.
The
forward contracts related to TDS' subsidiaries 11,327,674 Vodafone ADRs
matured in May and October 2007. TDS' subsidiaries elected to deliver a
substantial majority of the Vodafone ADRs in settlement of the forward
contracts, and disposed of all remaining Vodafone ADRs in connection
therewith and realized $4.6 million of cash proceeds. TDS recorded
a pre-tax gain of $171.6 million in 2007 on the settlement of such
forward contracts and the disposition of such remaining ADRs. As a
result of the settlement of these forward contracts in May and October
2007, TDS' subsidiaries no longer own any Vodafone ADRs and no longer
have any liability or other obligations under the related forward
contracts.
TDS
elected to deliver a substantial majority of the 45,492,172 Deutsche
Telekom ordinary shares reflected in current assets as of
December 31, 2006, in settlement of the forward contracts relating
to such Deutsche Telekom ordinary shares, which matured in July through
September 2007, and disposed of the remaining Deutsche Telekom ordinary
shares related to such forward contracts and realized
$81.2 million of cash proceeds. TDS recorded a pre-tax gain of
$248.9 million in 2007 on the settlement of such forward contracts
and the disposition of such remaining shares. All Deutsche Telekom
ordinary shares held by TDS at December 31, 2007 and 2006 had the
same cost basis. After these forward contracts were settled in July
through September 2007, TDS now owns 85,969,689 Deutsche Telekom
ordinary shares.
The
forward contracts related to TDS' 85,969,689 Deutsche Telekom ordinary
shares mature between January and September 2008. Accordingly, such
Deutsche Telekom ordinary shares are classified as Current Assets and
the related forward contracts and derivative liability are classified
as Current Liabilities in the Consolidated Balance Sheet at
December 31, 2007.
The
forward contracts related to TDS' 2,361,333 VeriSign Common Shares
matured in May 2007. TDS elected to deliver a substantial majority of
the 2,361,333 VeriSign Common Shares in settlement of the forward
contracts, and disposed of all remaining VeriSign Common Shares in
connection therewith and realized $6.2 million of cash proceeds.
TDS recorded a pre-tax gain of $6.2 million in the second quarter
of 2007 on the settlement of such forward contracts and the disposition
of such remaining shares. As a result of the settlement of these
forward contracts in May 2007, TDS no longer owns any VeriSign Common
Shares and no longer has any liability or other obligations under the
related forward contracts.
TDS
and its subsidiaries own 719,396 shares of RCCC. On July 30,
2007, RCCC announced that Verizon Wireless has agreed to purchase the
outstanding shares of RCCC for $45 per share in cash. The acquisition
is expected to close in the first half of 2008. If the transaction
closes, TDS will receive approximately $32.4 million in cash,
recognize a $31.7 million pre-tax gain and cease to own any
interest in RCCC.
TDS
recorded dividend income on its Deutsche Telekom investment of
$128.5 million, $120.3 million and $105.7 million,
before taxes, in 2007, 2006 and 2005, respectively.
NOTE 11 INVESTMENTS IN UNCONSOLIDATED ENTITIES
Investments
in unconsolidated entities consist of amounts invested in wireless and
wireline entities in which TDS holds a minority interest. These
investments are accounted for using either the equity or cost method,
as shown in the following table:
December 31,
|
|
2007 |
|
2006 |
|
| (Dollars in thousands) |
|
|
|
| Equity method investments: |
|
|
|
|
|
|
|
| |
Capital contributions, loans and advances |
|
$ |
34,612 |
|
$ |
30,190 |
|
| |
Goodwill |
|
|
9,157 |
|
|
9,156 |
|
| |
Cumulative share of income |
|
|
624,043 |
|
|
528,791 |
|
| |
Cumulative share of distributions |
|
|
(474,113 |
) |
|
(383,480 |
) |
| |
|
|
193,699 |
|
|
184,657 |
|
| Cost method investments |
|
|
12,719 |
|
|
12,979 |
|
Total investments in unconsolidated entities |
|
$ |
206,418 |
|
$ |
197,636 |
|
Investments
in unconsolidated entities include goodwill and costs in excess of the
underlying book value of certain investments.
Equity
in earnings of unconsolidated entities totaled $91.8 million,
$95.2 million and $68.0 million in 2007, 2006 and 2005,
respectively; of those amounts, TDS' investment in the Los Angeles SMSA
Limited Partnership ("LA Partnership") contributed
$71.2 million, $62.3 million and $52.2 million to equity
in earnings of unconsolidated entities in 2007, 2006 and 2005,
respectively. TDS held a 5.5% ownership interest in the
LA Partnership throughout and at the end of each of these years.
Based
primarily on data furnished to TDS by third parties, the following
summarizes the combined assets, liabilities and equity, and the
combined results of operations, of TDS' equity method investments.
December 31,
|
|
2007 |
|
2006 |
| (Dollars in thousands) |
|
|
| Assets |
|
|
|
|
|
|
| |
Current |
|
$ |
434,000 |
|
$ |
516,000 |
| |
Due from affiliates |
|
|
429,000 |
|
|
387,000 |
| |
Property and other |
|
|
1,936,000 |
|
|
2,015,000 |
| |
|
$ |
2,799,000 |
|
$ |
2,918,000 |
Liabilities and Equity |
|
|
|
|
|
|
| |
Current liabilities |
|
$ |
241,000 |
|
$ |
266,000 |
| |
Deferred credits |
|
|
98,000 |
|
|
102,000 |
| |
Long-term debt |
|
|
27,000 |
|
|
29,000 |
| |
Long-term capital lease obligations |
|
|
48,000 |
|
|
45,000 |
| |
Partners' capital and stockholders' equity |
|
|
2,385,000 |
|
|
2,476,000 |
| |
|
$ |
2,799,000 |
|
$ |
2,918,000 |
Year Ended December 31,
|
|
2007 |
|
2006 |
|
2005 |
| (Dollars in thousands) |
|
|
| Results of Operations |
|
|
|
|
|
|
|
|
|
| |
Revenues |
|
$ |
4,519,000 |
|
$ |
4,216,000 |
|
$ |
3,472,000 |
| |
Operating expenses |
|
|
3,092,000 |
|
|
2,922,000 |
|
|
2,430,000 |
| |
|
Operating income |
|
|
1,427,000 |
|
|
1,294,000 |
|
|
1,042,000 |
| |
Other income (expense) |
|
|
32,000 |
|
|
53,000 |
|
|
21,000 |
| |
Net income |
|
$ |
1,459,000 |
|
$ |
1,347,000 |
|
$ |
1,063,000 |
NOTE 12 PROPERTY, PLANT AND EQUIPMENT
U.S. Cellular's
property, plant and equipment in service and under construction, net of
accumulated depreciation, consists of:
December 31,
|
|
Useful Lives |
|
2007 |
|
2006 |
|
| (Dollars in thousands) |
|
(Years)
|
|
|
|
|
|
| Land |
|
N/A |
|
$ |
25,359 |
|
$ |
25,297 |
|
| Buildings |
|
20 |
|
|
254,650 |
|
|
237,479 |
|
| Leasehold improvements |
|
1-30 |
|
|
824,206 |
|
|
740,218 |
|
| Cell site equipment |
|
6-25 |
|
|
2,374,769 |
|
|
2,329,898 |
|
| Switching equipment |
|
1-8 |
|
|
803,908 |
|
|
757,183 |
|
| Office furniture and equipment |
|
3-5 |
|
|
441,762 |
|
|
412,914 |
|
| Other operating equipment |
|
5-25 |
|
|
271,941 |
|
|
285,009 |
|
| System development |
|
3-7 |
|
|
250,350 |
|
|
238,347 |
|
| Work in process |
|
N/A |
|
|
162,170 |
|
|
94,649 |
|
| |
|
|
|
|
5,409,115 |
|
|
5,120,994 |
|
| Accumulated depreciation |
|
|
|
|
(2,814,019 |
) |
|
(2,492,146 |
) |
| |
|
|
|
$ |
2,595,096 |
|
$ |
2,628,848 |
|
Depreciation
expense totaled $543.1 million, $497.1 million and
$444.7 million in 2007, 2006 and 2005, respectively. Amortization
expense on system development costs totaled $15.9 million,
$27.9 million and $29.4 million in 2007, 2006 and 2005,
respectively. Amortization of system development costs decreased in
2007 primarily due to a billing system becoming fully amortized in
2006.
In
2007, 2006 and 2005, (gain)/loss on asset disposals/exchanges included
charges of $34.1 million, $19.6 million and
$20.4 million, respectively, related to disposals of assets,
trade-ins of older assets for replacement assets and other retirements
of assets from service. In 2007, U.S. Cellular conducted a
physical inventory of its significant cell site and switching assets.
As a result, (gain)/loss on asset disposals/exchanges included a charge
of $14.6 million in 2007 reflecting the results of the physical
inventory and related valuation and reconciliation.
TDS Telecom's
property, plant and equipment in service and under construction, net of accumulated depreciation, consists of the following:
December 31,
|
|
Useful Lives |
|
2007 |
|
2006 |
|
| (Dollars in thousands) |
|
(Years)
|
|
|
|
|
|
| ILEC Operations |
|
|
|
|
|
|
|
|
|
| |
Cable and wire |
|
15-20 |
|
$ |
1,204,666 |
|
$ |
1,154,572 |
|
| |
Central office equipment |
|
8-12 |
|
|
700,780 |
|
|
673,152 |
|
| |
Office furniture and equipment |
|
5-10 |
|
|
71,573 |
|
|
81,410 |
|
| |
Systems development |
|
5-7 |
|
|
121,623 |
|
|
124,038 |
|
| |
Land |
|
N/A |
|
|
5,860 |
|
|
5,959 |
|
| |
Buildings |
|
30 |
|
|
76,956 |
|
|
77,065 |
|
| |
Other equipment |
|
10-15 |
|
|
32,067 |
|
|
69,355 |
|
| |
Work in process |
|
N/A |
|
|
68,920 |
|
|
37,514 |
|
| |
|
|
|
|
2,282,445 |
|
|
2,223,065 |
|
| |
Accumulated depreciation |
|
|
|
|
(1,474,905 |
) |
|
(1,396,684 |
) |
| |
|
|
|
|
807,540 |
|
|
826,381 |
|
CLEC Operations |
|
|
|
|
|
|
|
|
|
| |
Cable and wire |
|
15-20 |
|
|
70,065 |
|
|
65,709 |
|
| |
Central office equipment |
|
5-12 |
|
|
166,598 |
|
|
157,905 |
|
| |
Office furniture and equipment |
|
5-10 |
|
|
25,222 |
|
|
24,998 |
|
| |
Systems development |
|
5-7 |
|
|
16,659 |
|
|
15,367 |
|
| |
Land |
|
N/A |
|
|
74 |
|
|
74 |
|
| |
Buildings |
|
30 |
|
|
291 |
|
|
291 |
|
| |
Other equipment |
|
10-15 |
|
|
11,206 |
|
|
10,794 |
|
| |
Work in process |
|
N/A |
|
|
3,024 |
|
|
1,644 |
|
| |
|
|
|
|
293,139 |
|
|
276,782 |
|
| |
Accumulated depreciation |
|
|
|
|
(200,412 |
) |
|
(182,813 |
) |
| |
|
|
|
|
92,727 |
|
|
93,969 |
|
| Total |
|
|
|
$ |
900,267 |
|
$ |
920,350 |
|
The
provision for ILEC depreciation as a percentage of depreciable property
was 6.0% in 2007, 6.4% in 2006 and 6.5% in 2005. ILEC depreciation
expense totaled $131.3 million, $133.9 million and
$133.3 million in 2007, 2006 and 2005, respectively. ILEC
amortization expense totaled $2.1 million, $1.5 million and
$1.9 million in 2007, 2006 and 2005, respectively.
The
provision for CLEC depreciation as a percentage of depreciable property
was 7.8% in 2007, 8.5% in 2006 and 11.3% in 2005. CLEC depreciation
expense totaled $20.5 million, $20.2 million and
$24.9 million in 2007, 2006 and 2005, respectively. CLEC
amortization expense totaled $3.5 million, $4.0 million and
$5.5 million in 2007, 2006 and 2005, respectively.
Corporate
and other property, plant and equipment consists of the following:
December 31,
|
|
2007 |
|
2006 |
|
| (Dollars in thousands) |
|
|
|
| Property, plant and equipment |
|
$ |
79,530 |
|
$ |
79,905 |
|
| Accumulated depreciation |
|
|
(49,791 |
) |
|
(47,717 |
) |
| Total |
|
$ |
29,739 |
|
$ |
32,188 |
|
Corporate
and other fixed assets consist of assets at the TDS corporate offices
and Suttle Straus. The corporate assets primarily consist of office
furniture and equipment with useful lives ranging from three to seven
years. Depreciation and amortization expense is computed on a
straight-line basis, and the corporate amount is assessed out to
U.S. Cellular and TDS Telecom. The amounts assessed out
totaled $6.1 million, $6.1 million and $6.2 million in
2007, 2006 and 2005. The Suttle Straus assets primarily consist of a
building, equipment and vehicles with useful lives ranging from
40 years for the building to one to ten years for equipment and
vehicles. Depreciation expense is computed on a straight-line basis and
totaled $2.6 million, $2.8 million and $2.8 million in
2007, 2006 and 2005.
NOTE 13 ASSET RETIREMENT OBLIGATIONS
U.S. Cellular
is subject to asset retirement obligations associated with its leased
cell sites, switching office sites, retail store sites and office
locations. Asset retirement obligations generally include obligations
to restore leased land and retail store and office premises to their
pre-lease conditions.
During
the third quarters of 2007 and 2006, U.S. Cellular performed its
annual review of the assumptions and estimated costs related to its
asset retirement obligations. As a result of the reviews, the
liabilities were revised as follows:
- In
2007, the liabilities were revised to reflect lower estimated cash
outflows as a result of lower estimates of removal and restoration
costs, primarily related to cell sites, as determined through quoted
market prices obtained from independent contractors.
- In
2006, the liabilities were revised to reflect higher estimated costs
for removal of radio and power equipment related to cell sites, and
estimated retirement obligations for retail stores were revised to
reflect a shift to larger stores and slightly higher estimated costs
for removal of fixtures.
The
changes in U.S. Cellular's asset retirement obligation during 2007 and 2006 were as follows:
Year Ended December 31,
|
|
2007 |
|
2006 |
|
| (Dollars in thousands) |
|
|
|
| Beginning balance |
|
$ |
127,639 |
|
$ |
90,224 |
|
| |
Additional liabilities accrued |
|
|
5,974 |
|
|
15,697 |
|
| |
Revision in estimated cash outflows |
|
|
(15,331 |
) |
|
13,415 |
|
| |
Acquisition of assets |
|
|
348 |
|
|
1,237 |
|
| |
Disposition of assets |
|
|
(555 |
) |
|
(164 |
) |
| |
Accretion expense |
|
|
8,769 |
|
|
7,230 |
|
| Ending balance |
|
$ |
126,844 |
|
$ |
127,639 |
|
TDS Telecom's
ILECs have recorded an asset retirement obligation in accordance with
the requirements of SFAS 143 and FIN 47. Prior to the
discontinuance of SFAS 71, an additional regulatory liability was
recorded which represented the amount of costs of removal that state
public utility commissions required to be recorded in excess of the
amounts required to be recorded in accordance with SFAS 143 and
FIN 47. See Note 5–Extraordinary Item–Discontinuance of the
Application of Statement of Financial Accounting Standards No. 71,
Accounting for the Effects of Certain Types of Regulation, for
additional details.
The
changes in TDS Telecom's ILECs' asset retirement obligation and
regulatory obligation during 2007 and 2006 were as follows:
Year Ended December 31,
|
|
2007 |
|
2006 |
|
| (Dollars in thousands) |
|
|
|
| Beginning balance |
|
$ |
101,647 |
|
$ |
97,509 |
|
| |
Additional liabilities accrued |
|
|
11,963 |
|
|
4,800 |
|
| |
Costs of removal |
|
|
(567 |
) |
|
(697 |
) |
| |
Accretion expense |
|
|
737 |
|
|
35 |
|
| |
Discontinuance of SFAS 71 |
|
|
(70,107 |
) |
|
– |
|
| Ending balance |
|
$ |
43,673 |
|
$ |
101,647 |
|
The
regulatory liability included in TDS Telecom's ILECs' asset
retirement obligation at December 31, 2006 was $62.6 million.
During
the fourth quarter of 2007, TDS Telecom reviewed the assumptions
related to its asset retirement obligation and, as a result of the
review, revised its inflation factor downward in relationship to its
future CLEC asset retirement obligation. The impact of this change is
reflected in the "Revision in estimated cash outflows" below.
The
changes in TDS Telecom's CLECs' asset retirement obligation during 2007 and 2006 were as follows:
Year Ended December 31,
|
|
2007 |
|
2006 |
| (Dollars in thousands) |
|
|
| Beginning balance |
|
$ |
3,026 |
|
$ |
2,649 |
| |
Additional liabilities accrued |
|
|
– |
|
|
186 |
| |
Revision in estimated cash outflows |
|
|
(289 |
) |
|
– |
| |
Accretion expense |
|
|
214 |
|
|
191 |
| Ending balance |
|
$ |
2,951 |
|
$ |
3,026 |
NOTE 14 NOTES PAYABLE
TDS
has used short-term debt to finance acquisitions, for general corporate
purposes and to repurchase common shares. Proceeds from the sale of
long-term debt from time to time have been used to reduce such
short-term debt. Proceeds from the sale of non-strategic wireless and
other investments from time to time also have been used to reduce
short-term debt.
TDS
has a $600 million revolving credit facility available for general
corporate purposes. At December 31, 2007, outstanding letters of
credit were $3.4 million leaving $596.6 million available for
use. Borrowings under the revolving credit facility bear interest at
the London InterBank Offered Rate ("LIBOR") plus a contractual spread
based on TDS' credit rating. TDS may select borrowing periods of either
seven days or one, two, three or six months. At December 31, 2007,
one-month LIBOR was 4.60% and the contractual spread was 75 basis
points. If TDS provides less than two days' notice of intent to borrow,
the related borrowings bear interest at the prime rate less 50 basis
points (the prime rate was 7.25% at December 31, 2007). This
credit facility expires in December 2009. In 2007, TDS paid fees at an
aggregate annual rate of 0.40% of the total $600 million facility.
These fees totaled $2.4 million, $2.0 million and
$0.8 million in 2007, 2006 and 2005, respectively.
TDS
also had $25 million in direct bank lines of credit at
December 31, 2007, all of which were unused. The terms of the
direct bank lines of credit provide for borrowings at negotiated rates
up to the prime rate.
U.S. Cellular
has a $700 million revolving credit facility available for general
corporate purposes. At December 31, 2007, outstanding letters of
credit were $0.2 million leaving $699.8 million available for
use. Borrowings under the revolving credit facility bear interest at
the LIBOR plus a contractual spread based on U.S. Cellular's
credit rating. U.S. Cellular may select borrowing periods of
either seven days or one, two, three or six months. At
December 31, 2007, the one-month LIBOR was 4.60% and the
contractual spread was 75 basis points. If U.S. Cellular provides
less than two days' notice of intent to borrow, the related borrowings
bear interest at the prime rate less 50 basis points. This credit
facility expires in December 2009. In 2007, U.S. Cellular paid
fees at an aggregate annual rate of 0.39% of the total facility. These
fees totaled $2.8 million, $2.3 million and $1.0 million
in 2007, 2006 and 2005, respectively.
Information
concerning notes payable is shown in the table below:
Year Ended December 31,
|
|
2007 |
|
2006 |
|
| (Dollars in thousands) |
|
|
|
| Balance at end of year |
|
$ |
0 |
|
$ |
35,000 |
|
| Weighted average interest rate at end of year |
|
|
N/A |
|
|
5.96 |
% |
| Maximum amount outstanding during the year |
|
$ |
60,000 |
|
$ |
170,000 |
|
| Average amount outstanding during the year(1) |
|
$ |
20,000 |
|
$ |
91,250 |
|
| Weighted average interest rate during the year(1) |
|
|
6.03 |
% |
|
5.68 |
% |
TDS'
and U.S. Cellular's interest cost on their revolving credit
facilities would increase if their current credit ratings from either
Standard & Poor's Rating Services ("Standard &
Poor's") or Moody's Investor Service ("Moody's") were lowered. However,
the credit facilities would not cease to be available or accelerate
solely as a result of a decline in TDS' or U.S. Cellular's credit
rating. A downgrade in TDS' or U.S. Cellular's credit rating could
adversely affect their ability to renew existing, or obtain access to
new credit facilities in the future. TDS' and U.S. Cellular's
credit ratings as of December 31, 2007, and the dates that such
ratings were issued, were as follows:
| Moody's (Issued September 20, 2007) |
Baa3 |
|
–stable outlook |
| Standard & Poor's (Issued June 21, 2007) |
BB+ |
|
–with developing outlook |
| Fitch (Issued August 16, 2007) |
BBB+ |
|
–stable outlook |
On
September 20, 2007, Moody's changed its outlook on TDS and
U.S. Cellular's credit rating to stable from under review for
possible further downgrade.
On
February 13, 2007, Standard & Poor's lowered its credit
ratings on TDS and U.S. Cellular to BBB- from BBB. The ratings
remained on credit watch with negative implications. On April 23,
2007, Standard & Poor's lowered its credit rating on TDS and
U.S. Cellular to BB+ from BBB-. The ratings remained on credit
watch with negative implications. On June 21, 2007,
Standard & Poor's affirmed the BB+ rating, and removed TDS and
U.S. Cellular from credit watch. The outlook is developing.
On
August 16, 2007, Fitch changed its outlook on TDS and
U.S. Cellular's credit rating to stable from ratings watch
negative.
The
maturity dates of certain TDS and U.S. Cellular' revolving credit
facilities would accelerate in the event of a change in control.
The
financial covenants associated with TDS' and U.S. Cellular's lines
of credit require that each company maintain certain debt-to-capital
and interest coverage ratios. The covenants of U.S. Cellular's
revolving credit facility also prescribe certain terms associated with
intercompany loans from TDS or TDS subsidiaries to U.S. Cellular
or U.S. Cellular subsidiaries.
The
continued availability of the revolving credit facility requires TDS
and U.S. Cellular to comply with certain negative and affirmative
covenants, maintain certain financial ratios and make representations
regarding certain matters at the time of each borrowing. On
November 6, 2006, TDS and U.S. Cellular announced that they
would restate certain financial statements which caused TDS and
U.S. Cellular to be late with certain filings. In addition, on
April 23, 2007, TDS announced another restatement that caused a
further delay in TDS' SEC filings. Before TDS and U.S. Cellular
filed the foregoing restatements and became current in their SEC
filings on or prior to June 19, 2007, the restatements and late
filings resulted in defaults under the revolving credit agreements and
one line of credit agreement. TDS and U.S. Cellular were not in
violation of any covenants that require TDS and U.S. Cellular to
maintain certain financial ratios, and TDS and U.S. Cellular did
not fail to make any scheduled payments under such credit agreements.
TDS and U.S. Cellular received waivers from the lenders associated
with the credit agreements, under which the lenders agreed to waive any
defaults that may have occurred as a result of the restatements and
late filings. TDS and U.S. Cellular believe they were in
compliance as of December 31, 2007 with all covenants and other
requirements set forth in the revolving credit facilities and lines of
credit.
NOTE 15 LONG-TERM DEBT AND FORWARD CONTRACTS
Long-term debt is as follows:
December 31,
|
|
2007 |
|
2006 |
|
| (Dollars in thousands) |
|
|
|
| Telephone and Data Systems, Inc. (Parent) |
|
|
|
|
|
|
|
| |
6.625% senior notes, maturing 2045 |
|
$ |
116,250 |
|
$ |
116,250 |
|
| |
7.6% Series A notes, due in 2041 |
|
|
500,000 |
|
|
500,000 |
|
| |
Purchase contracts, averaging 6.0%, due through 2021 |
|
|
1,097 |
|
|
1,097 |
|
| |
|
|
Total Parent |
|
|
617,347 |
|
|
617,347 |
|
| Subsidiaries |
|
|
|
|
|
|
|
|
U.S. Cellular |
|
|
|
|
|
|
|
| |
6.7% senior notes maturing in 2033 |
|
|
544,000 |
|
|
544,000 |
|
| |
|
Unamortized discount |
|
|
(11,707 |
) |
|
(12,161 |
) |
| |
|
|
532,293 |
|
|
531,839 |
|
| |
7.5% senior notes, maturing in 2034 |
|
|
330,000 |
|
|
330,000 |
|
| |
8.75% senior notes, maturing in 2032 |
|
|
130,000 |
|
|
130,000 |
|
| |
Other, 9.0% due in 2009 |
|
|
10,000 |
|
|
10,000 |
|
| TDS Telecom |
|
|
|
|
|
|
|
| |
Rural Utilities Service notes, 0.0% in 2007 and 0.0% in 2006, due through 2015 |
|
|
3,563 |
|
|
4,041 |
|
| |
Other long-term notes, 0.0% in 2007 and 0.0% in 2006, due through 2012 |
|
|
25 |
|
|
35 |
|
| Other Subsidiaries |
|
|
|
|
|
|
|
| |
Long-term notes, 2.7% to 10.6%, due through 2012 |
|
|
12,858 |
|
|
12,963 |
|
| Total Subsidiaries |
|
|
1,018,739 |
|
|
1,018,878 |
|
| Total Long-term debt |
|
|
1,636,086 |
|
|
1,636,225 |
|
| |
Less: Current portion of long-term debt |
|
|
3,860 |
|
|
2,917 |
|
| Total Long-term debt, excluding current portion |
|
$ |
1,632,226 |
|
$ |
1,633,308 |
|
Telephone and Data Systems, Inc. (Parent)
On
March 31, 2005, TDS issued $116.25 million in aggregate
principal amount of unsecured 6.625% senior notes due March 31,
2045. Interest on the notes is payable quarterly. TDS may redeem the
notes, in whole or in part, at any time on or after March 31,
2010, at a redemption price equal to 100% of the principal amount
redeemed plus accrued and unpaid interest to the redemption date. The
net proceeds from this offering, after deducting underwriting
discounts, were approximately $112.6 million.
The
unsecured 7.6% Series A notes, issued in 2001, are due in 2041.
Interest is payable quarterly. The notes are redeemable by TDS
beginning December 2006 at 100% of the principal amount plus accrued
and unpaid interest.
Subsidiaries–U.S. Cellular
The
6.7% senior notes are due December 15, 2033. Interest is paid
semi-annually. U.S. Cellular may redeem the notes, in whole or in
part, at any time prior to maturity at a redemption price equal to the
greater of (a) 100% of the principal amount of such notes, plus
accrued but unpaid interest, or (b) the sum of the present values
of the remaining scheduled payments of principal and interest thereon
discounted to the redemption date on a semi-annual basis at the
Treasury Rate plus 30 basis points.
The
7.5% senior notes are due June 15, 2034. Interest on the notes is
payable quarterly. U.S. Cellular may redeem the notes, in whole or
in part, at any time on and after June 17, 2009, at a redemption
price equal to 100% of the principal amount redeemed plus accrued
interest.
The
8.75% senior notes are due November 7, 2032. Interest is paid
quarterly. U.S. Cellular may redeem the notes, in whole or in
part, beginning in November 2007 at the principal amount plus accrued
interest.
Subsidiaries–TDS Telecom
Prior
to 2005, TDS Telecom's Rural Utilities Service ("RUS"), Rural
Telephone Bank ("RTB") and Federal Financing Bank ("FFB") Mortgage
notes issued under certain loan agreements with the RUS, RTB and FFB,
agencies of the United States of America, were repaid in equal monthly
or quarterly installments covering principal and interest beginning six
months to three years after dates of issue and expiring through 2035.
Substantially all telephone plant of the ILEC companies was pledged
under RUS and RTB mortgage notes and various other obligations of the
telephone subsidiaries.
On
March 31, 2005, TDS Telecom subsidiaries repaid approximately
$105.6 million in principal amount of notes to the RUS and the RTB
plus accrued interest of $0.6 million. TDS Telecom
subsidiaries incurred prepayment costs of $0.6 million associated
with these repayments. Unamortized debt issuance costs related to the
notes totaling $0.1 million were expensed and included in Other,
net in the Consolidated Statements of Operations.
On
June 30, 2005, TDS Telecom subsidiaries repaid approximately
$127.0 million in principal amount of notes to the RUS, the RTB,
the FFB and the Rural Telephone Finance Cooperative ("RTFC"), a
member-owned, not-for-profit lending cooperative that serves the
financial needs of the rural telecommunications industry.
TDS Telecom subsidiaries paid accrued interest of
$0.8 million and additional prepayment costs of $1.2 million
associated with these repayments. Unamortized debt issuance costs
related to the notes totaling $0.3 million were expensed and
included in Other, net in the Statements of Operations.
The
remaining RUS long-term debt consists of rural economic development
loans that are non-interest bearing. Rural economic development loans
are zero-interest loans provided to electric and telephone utilities to
promote sustainable rural economic development and job creation
projects. Pursuant to the guidelines prescribed by the RUS,
TDS Telecom has in turn loaned these funds at 0% interest to
businesses in the communities that TDS Telecom serves in order to
promote economic growth. As a result of the conditions imposed by RUS
and the attributes of this governmental agency, interest has not been
imputed on either the rural economic development loan or the associated
customer financing receivable.
Consolidated
The
annual requirements for principal payments on long-term debt, excluding
amounts due on the forward contracts, are approximately
$3.9 million, $15.1 million, $4.4 million,
$0.8 million and $0.4 million for the years 2008 through
2012, respectively.
The
covenants associated with TDS' long-term debt obligations, among other
things, restrict TDS' ability, subject to certain exclusions, to incur
additional liens; enter into sale and leaseback transactions; and sell,
consolidate or merge assets.
On
November 6, 2006, TDS and U.S. Cellular announced that they
would restate certain financial statements which caused TDS and
U.S. Cellular to be late with certain filings. In addition, on
April 23, 2007, TDS announced another restatement that caused a
further delay in TDS' SEC filings. Before TDS and U.S. Cellular
filed the foregoing restatements and became current in their SEC
filings on or prior to June 19, 2007, the restatements and late
filings resulted in non-compliance under such debt indentures. However,
this non-compliance did not result in an event of default or a default.
TDS and U.S. Cellular believe that such non-compliance was cured
upon the filing of their respective Forms 10-Q and
Forms 10-K. TDS and U.S. Cellular have not failed to make nor
do they expect to fail to make any scheduled payment of principal or
interest under such indentures.
In
addition, the covenants associated with long-term debt obligations of
certain subsidiaries of TDS, among other things, restrict these
subsidiaries' ability, subject to certain exclusions, to incur
additional liens; enter into sale and leaseback transactions; sell,
consolidate or merge assets, and pay dividends.
Forward Contracts
TDS
holds available-for-sale marketable equity securities, the majority of
which were the result of sales or trades of non-strategic assets.
Subsidiaries of TDS have variable prepaid forward contracts ("forward
contracts") with counterparties in connection with its Deutsche Telekom
securities. The principal amount of the forward contracts was accounted
for as a loan. The forward contracts contain embedded collars that are
bifurcated and receive separate accounting treatment in accordance with
SFAS No. 133, Accounting for Derivative Instruments and Hedging Activities. The following table summarizes certain facts surrounding the
contracted securities, pledged as collateral for the forward contracts.
December 31,
Security
|
|
2007
Shares |
|
2007
Loan Amount |
|
2006
Shares |
|
2006
Loan Amount |
|
| (Dollars in thousands) |
|
|
|
| Forward Contracts–Current Liabilities |
|
|
|
|
|
|
|
|
|
|
|
| |
Deutsche Telekom |
|
85,969,689 |
|
$ |
1,015,365 |
|
45,492,172 |
|
$ |
516,892 |
|
| |
Unamortized debt discount |
|
|
|
|
(9,853 |
) |
|
|
|
– |
|
| |
|
Deutsche Telekom, net of unamortized debt discount |
|
|
|
|
1,005,512 |
|
|
|
|
516,892 |
|
| |
Vodafone |
|
|
|
|
– |
|
11,327,674 |
|
|
201,038 |
|
| |
VeriSign |
|
|
|
|
– |
|
2,361,333 |
|
|
20,819 |
|
| |
Unamortized debt discount |
|
|
|
|
– |
|
|
|
|
(341 |
) |
| |
|
VeriSign, net of unamortized debt discount |
|
|
|
|
– |
|
|
|
|
20,478 |
|
| Total Forward Contracts included in Current Liabilities |
|
|
|
|
1,005,512 |
|
|
|
|
738,408 |
|
Forward Contracts–Long-term Debt |
|
|
|
|
|
|
|
|
|
|
|
| |
Deutsche Telekom |
|
|
|
|
– |
|
85,969,689 |
|
|
1,015,365 |
|
| |
Unamortized debt discount |
|
|
|
|
– |
|
|
|
|
(28,064 |
) |
| |
|
Deutsche Telekom, net of unamortized debt discount |
|
|
|
|
– |
|
|
|
|
987,301 |
|
| Total Forward Contracts included in Long-Term Debt |
|
|
|
|
– |
|
|
|
|
987,301 |
|
| Total Forward Contracts |
|
|
|
$ |
1,005,512 |
|
|
|
$ |
1,725,709 |
|
During
2007, forward contracts related to the VeriSign common shares, Vodafone
ADRs and a portion of the Deutsche Telekom ordinary shares matured. See
Note 10–Marketable Equity Securities, for details on the
settlement of these forward contracts.
The
remaining Deutsche Telekom forward contracts mature from January to
September 2008. Accordingly, such Deutsche Telekom ordinary shares are
classified as Current Assets and the related forward contracts and
derivative liability are classified as Current Liabilities in the
Consolidated Balance Sheet at December 31, 2007. Contracts
aggregating $577.3 million require quarterly interest payments at
the LIBOR rate plus 50 basis points (the three-month LIBOR rate was
4.7% at December 31, 2007). Contracts aggregating
$438.0 million are structured as zero coupon obligations with a
weighted average effective interest rate of 4.4% per year. No interest
payments are required for the zero coupon obligations during the
contract period.
The
economic hedge risk management objective of the forward contracts is to
hedge the value of the marketable equity securities from losses due to
decreases in the market prices of the securities ("downside limit")
while retaining a share of gains from increases in the market prices of
such securities ("upside potential"). The downside limit is hedged at
or above the accounting cost basis of the securities.
Under
the terms of the forward contracts, TDS will continue to own the
contracted shares and will receive dividends paid on such contracted
shares, if any. The forward contracts may be settled in Deutsche
Telekom shares or in cash, pursuant to formulas that "collar" the price
of the shares. The collars effectively limit downside risk and upside
potential on the contracted shares. The collars typically are adjusted
contractually for any changes in dividends on the underlying shares. If
the dividend increases, the collar's upside potential typically is
reduced. If the dividend decreases, the collar's upside potential
typically is increased. If TDS elects to settle in shares, it will be
required to deliver the number of shares of the contracted security
determined pursuant to the formula. If shares are delivered in the
settlement of the forward contract, TDS would incur a current tax
liability at the time of delivery based on the difference between the
tax basis of the marketable equity securities delivered and the net
amount realized through maturity. If TDS elects to settle in cash, it
will be required to pay an amount in cash equal to the fair market
value of the number of shares determined pursuant to the formula.
TDS
is, and until May 2007 (when U.S. Cellular settled its forward
contracts as discussed above) U.S. Cellular was, required to
comply with certain covenants under the forward contracts. On
November 6, 2005, TDS and U.S. Cellular announced that they
would restate certain financial statements which caused TDS and
U.S. Cellular to be late with certain SEC filings. In addition, on
April 23, 2007, TDS announced another restatement that caused a
further delay in TDS' SEC filings. Before TDS and U.S. Cellular
filed the foregoing restatements and became current in their SEC
filings on or prior to June 19, 2007, the restatements and late
filings resulted in defaults under the forward contracts. TDS and
U.S. Cellular were not in violation of any covenants that require
TDS and U.S. Cellular to maintain certain financial ratios, and
TDS and U.S. Cellular did not fail to make any scheduled payments
under such forward contracts. TDS and U.S. Cellular received
waivers from the counterparty associated with the forward contracts,
under which the lenders agreed to waive any defaults that may have
occurred as a result of the restatements and late filings. TDS believes
that it was in compliance as of December 31, 2007 with all
covenants and other requirements set forth in its forward contracts.
NOTE 16 FINANCIAL INSTRUMENTS AND DERIVATIVES
Financial Instruments
Financial instruments are as follows:
| December 31, |
|
2007 |
|
2006 |
| |
Book Value |
|
Fair Value |
|
Book Value |
|
Fair Value |
| (Dollars in thousands) |
|
|
| Cash and cash equivalents |
|
$ |
1,174,446 |
|
$ |
1,174,446 |
|
$ |
1,013,325 |
|
$ |
1,013,325 |
| Current portion of long-term debt |
|
|
3,860 |
|
|
3,860 |
|
|
2,917 |
|
|
2,917 |
| Notes payable |
|
|
– |
|
|
– |
|
|
35,000 |
|
|
35,000 |
| Long-term debt |
|
|
1,632,226 |
|
|
1,411,081 |
|
|
1,633,308 |
|
|
1,636,164 |
| Forward contracts |
|
|
1,005,512 |
|
|
1,006,616 |
|
|
1,725,709 |
|
|
1,718,104 |
| Preferred shares |
|
$ |
860 |
|
$ |
578 |
|
$ |
863 |
|
$ |
745 |
The
carrying amounts of cash and cash equivalents, the current portion of
long-term debt and notes payable approximate fair value due to the
short-term nature of these financial instruments. The fair value of
long-term debt was estimated using market prices for TDS' 7.6%
Series A notes, and 6.625% senior notes, and U.S. Cellular's
6.7% senior notes, 7.5% senior notes, and 8.75% senior notes and
discounted cash flow analysis for remaining debt. The carrying amounts
of the variable rate forward contracts approximates fair value due to
the repricing of the instruments on a quarterly basis. The fair value
of the zero coupon forward contracts and preferred shares were
determined using discounted cash flow analysis.
Derivatives
TDS
has variable prepaid forward contracts ("forward contracts") in
connection with its Deutsche Telekom marketable equity securities. The
principal amount of the forward contracts is accounted for as a loan.
The collar portions of the forward contracts are accounted for as
derivative instruments. The following table summarizes the shares
contracted and the downside limit and upside potential.
December 31, 2007
Security
|
|
Shares |
|
Downside Limit
(Floor) |
|
Upside Potential
(Ceiling) |
| Deutsche Telekom |
|
85,969,689 |
|
$10.89 - $12.41 |
|
$12.40 - $14.99 |
During
2007, the forward contracts and embedded collars related to the
VeriSign common shares, Vodafone ADRs and a portion of the Deutsche
Telekom ordinary shares matured and were settled. See
Note 10–Marketable Equity Securities, for details on the
settlement of these forward contracts and embedded collars.
The
fair value of the derivative instruments is determined using the
Black-Scholes model. TDS reported a current derivative liability of
$711.7 million at December 31, 2007. TDS reported a
derivative liability of $753.8 million at December 31, 2006;
of this amount $360.0 million was current and $393.8 million
was noncurrent. These amounts are included in the Consolidated Balance
Sheets caption Derivative liability.
Fair
value adjustments of derivative instruments resulted in a loss of
$351.6 million and $299.5 million in 2007 and 2006,
respectively, and a gain of $733.7 million in 2005. Fair value
adjustments of derivative instruments reflect the change in the fair
value of the bifurcated embedded collars within the forward contracts
related to the Deutsche Telekom, Vodafone and VeriSign marketable
equity securities.
NOTE 17 EMPLOYEE BENEFIT PLANS
Pension Plan
TDS
sponsors a qualified noncontributory defined contribution pension plan.
The plan provides benefits for the employees of TDS Corporate,
TDS Telecom and U.S. Cellular. Under this plan, pension costs
are calculated separately for each participant and are funded
currently. Total pension costs were $14.1 million,
$14.3 million and $13.4 million in 2007, 2006 and 2005,
respectively.
TDS
also sponsors an unfunded nonqualified deferred supplemental executive
retirement plan to supplement the benefits under the plan to offset the
reduction of benefits caused by the limitation on annual employee
compensation under the tax laws.
Other Post-Retirement Benefits
TDS
sponsors two defined benefit post-retirement plans that cover most of
the employees of TDS Corporate, TDS Telecom and the subsidiaries
of TDS Telecom. One plan provides medical benefits and the other
provides life insurance benefits. Both plans are contributory, with
retiree contributions adjusted annually. The medical plan anticipates
future cost sharing changes that reflect TDS' intent to increase
retiree contributions as a portion of total cost.
In
September 2006, the FASB released SFAS No. 158, Employers' Accounting for Defined Benefit Pension and Other Postretirement Plans, an amendment of FASB
Statements No. 87, 88, 106, and 132(R) ("SFAS 158"). Under the new standard, companies must recognize a net liability or asset to report the funded status of
their defined benefit pension and other postretirement benefit plans on their balance sheets.
The recognition, disclosure and measurement provisions of SFAS 158 have been adopted by TDS as of December 31, 2006.
The
following amounts are included in other comprehensive income, before affecting such amounts for income taxes:
Amounts
Recognized in Accumulated Other Comprehensive Income
|
|
As of December 31, |
|
|
|
2007 |
|
2006 |
|
| (Dollars in thousands) |
|
|
|
| Net Prior Service Costs |
|
$ |
(5,342 |
) |
$ |
(6,172 |
) |
| Net Actuarial Loss |
|
|
19,645 |
|
|
26,469 |
|
| |
|
$ |
14,303 |
|
$ |
20,297 |
|
The
estimated net actuarial loss and prior service cost gain for the
postretirement benefit plans that will be amortized from Accumulated
other comprehensive income into net periodic benefit cost during 2008
are $1.0 million and $(0.8) million; respectively.
The
following amounts are included in other comprehensive income, before affecting such amounts for income taxes:
Other
Changes in Plan and Benefit Obligations
Recognized in Other Comprehensive Income "OCI"
December 31, 2007
|
|
Before-Tax |
|
Tax (Expense) or Benefit |
|
Net-of-Tax |
|
| (Dollars in thousands) |
|
|
|
| Net Actuarial Gains |
|
|
$5,462 |
|
|
$(2,361 |
) |
|
$3,101 |
|
| Amortization of Prior Service Costs |
|
|
(830 |
) |
|
359 |
|
|
(471 |
) |
| Amortization of Actuarial Losses |
|
|
1,362 |
|
|
(589 |
) |
|
773 |
|
| Total Recognized in OCI |
|
|
$5,994 |
|
|
$(2,591 |
) |
|
$3,403 |
|
The
following table reconciles the beginning and ending balances of the
benefit obligation and the fair value of plan assets for the other
post-retirement benefit plans.
December 31,
|
|
2007 |
|
2006 |
|
| (Dollars in thousands) |
|
|
|
| Change in benefit obligation |
|
|
|
|
|
|
|
| |
Benefit obligation at beginning of year |
|
$ |
60,408 |
|
$ |
51,385 |
|
| |
Service cost |
|
|
2,437 |
|
|
2,177 |
|
| |
Interest cost |
|
|
3,432 |
|
|
2,765 |
|
| |
Actuarial (gain) loss |
|
|
(6,249 |
) |
|
6,406 |
|
| |
Benefits paid |
|
|
(2,950 |
) |
|
(2,325 |
) |
| |
Benefit obligation at end of year |
|
|
57,078 |
|
|
60,408 |
|
Change in plan assets |
|
|
|
|
|
|
|
| |
Fair value of plan assets at beginning of year |
|
|
35,145 |
|
|
28,067 |
|
| |
Actual return on plan assets |
|
|
2,496 |
|
|
4,019 |
|
| |
Employer contribution |
|
|
7,195 |
|
|
5,541 |
|
| |
Benefits paid |
|
|
(2,950 |
) |
|
(2,482 |
) |
| |
Fair value of plan assets at end of year |
|
|
41,886 |
|
|
35,145 |
|
| Funded status |
|
$ |
(15,192 |
) |
$ |
(25,263 |
) |
Net
periodic benefit cost recorded in the consolidated statements of
operations for the years ended December 31, 2007, 2006 and 2005
includes the following components:
Year Ended December 31,
|
|
2007 |
|
2006 |
|
2005 |
|
| (Dollars in thousands) |
|
|
|
| Service cost |
|
$ |
2,437 |
|
$ |
2,177 |
|
$ |
2,212 |
|
| Interest cost on accumulated post-retirement benefit obligation |
|
|
3,432 |
|
|
2,765 |
|
|
2,636 |
|
| Expected return on plan assets |
|
|
(3,284 |
) |
|
(2,593 |
) |
|
(2,231 |
) |
| Amortization of: |
|
|
|
|
|
|
|
|
|
|
| |
Unrecognized prior service cost(1) |
|
|
(830 |
) |
|
(830 |
) |
|
(1,117 |
) |
| |
Unrecognized net loss(2) |
|
|
1,362 |
|
|
1,168 |
|
|
1,153 |
|
| Net post-retirement cost |
|
$ |
3,117 |
|
$ |
2,687 |
|
$ |
2,653 |
|
The
following assumptions were used to determine benefit obligations and net periodic benefit cost:
December 31,
|
|
2007 |
|
2006 |
|
| Discount rate |
|
6.20 |
% |
5.80 |
% |
| Expected return on plan assets |
|
8.50 |
% |
8.50 |
% |
In
determining the discount rate, TDS considered the Moody's Aa Corporate
Bond Index and actuarial bond yield curves that matched the expected
timing and cash flows of TDS' benefit payments. TDS determined that the
Moody's Aa Corporate Bond Index rate adequately matched the expected
timing and cash flows of TDS' benefit payments, and that no adjustments
were needed.
The
measurement date for actuarial determination was December 31,
2007. For measurement purposes, the annual rate of increase in the per
capita cost of covered health care benefits was assumed for 2007 to be
10.3% for plan participants aged 65 and above, and 9.1% for
participants under age 65. For all participants the 2007 annual rate of
increase is expected to decrease to 5% by 2014. The 2006 expected rate
of increase was 12.5% for plan participants aged 65 and above, and
10.2% for participants under age 65, decreasing to 5.0% by 2013.
The
health care cost trend rate assumption has a significant effect on the
amounts reported. A one percentage point increase or decrease in
assumed health care cost trend rates would have the following effects:
|
|
One Percentage Point |
|
|
|
Increase |
|
Decrease |
|
| (Dollars in thousands) |
|
|
|
| Effect on total of service and interest cost components |
|
$ |
973 |
|
$ |
(822 |
) |
| Effect on post-retirement benefit obligation |
|
$ |
8,221 |
|
$ |
(7,186 |
) |
The following table describes how plan assets are invested.
|
|
|
|
Allocation of Plan Assets
At December 31, |
|
Investment
Category
|
|
Target Asset
Allocation |
|
| |
2007 |
|
2006 |
|
| U.S. Equities |
|
50 |
% |
52.0 |
% |
52.8 |
% |
| International Equities |
|
15 |
% |
16.1 |
% |
15.5 |
% |
| Debt Securities |
|
35 |
% |
31.9 |
% |
31.7 |
% |
The
post-retirement benefit fund engages multiple asset managers to ensure
proper diversification of the investment portfolio within each asset
category. The investment objective is to exceed the rate of return of a
performance index comprised of 50% Wilshire 5000 Stock Index, 15% MSCI
World (excluding U.S.) Stock Index, and 35% Lehman Brothers Aggregate
Bond Index. The three-year and five-year average rates of return for
this index are 8.6% and 11.5%, respectively. For purposes of
determining benefit obligations and net periodic benefit cost, an
expected return on plan assets of 8.5% was used. The 8.5% rate of
return assumption is also consistent with projected future returns
based on the fund's asset mix.
The
post-retirement benefit fund does not hold any debt or equity
securities issued by TDS, U.S. Cellular or any related parties.
TDS
is not required to set aside current funds for its future retiree
health and life insurance benefits. The decision to contribute to the
plan assets is based upon several factors, including the funded status
of the plan, market conditions, alternative investment opportunities,
tax benefits and other circumstances. Total accumulated contributions
to fund the costs of future retiree medical benefits are restricted to
an amount not to exceed 25 percent of the total accumulated
contributions to the pension trust. An additional contribution equal to
a reasonable amortization of the past service cost may be made without
regard to the 25 percent limitation. TDS expects to fund
$5.6 million in 2008 for the 2007 contribution to the plan.
The
following estimated future benefit payments, which reflect expected future service, are expected to be paid:
Year
|
|
Estimated Future
Post-retirement
Benefit Payments |
| (Dollars in thousands) |
|
|
| 2008 |
|
|
$ 2,810 |
| 2009 |
|
|
3,004 |
| 2010 |
|
|
3,098 |
| 2011 |
|
|
3,159 |
| 2012 |
|
|
3,171 |
| 2013-2017 |
|
|
18,587 |
On
December 8, 2003, the Medicare Prescription Drug, Improvement and
Modernization Act of 2003 (the "Act") was enacted. The Act expanded
Medicare coverage, primarily by adding a prescription drug benefit for
Medicare-eligible participants starting in 2006. The Act provided
employers currently sponsoring prescription drug programs for
Medicare-eligible participants with a range of options for coordinating
with the new government-sponsored program to potentially reduce
employers' costs. One alternative allowed employers to receive a
subsidy from the federal government for all retirees enrolled in the
employer-sponsored prescription drug plan. Final regulations released
by the Centers for Medicare and Medicaid Services ("CMS") in 2005,
along with additional guidance issued throughout 2005, led to a final
determination that the plan would qualify for the government subsidy
for calendar year 2006. After an evaluation of the options available,
TDS determined that the most beneficial option would be to accept the
direct subsidy from the federal government. During the fourth quarter
of 2005, TDS notified its employees of this decision and applied for
the federal subsidy.
TDS'
accumulated postretirement benefit obligation "APBO" has been reduced
by approximately $13.8 million and $17.1 million as of
December 31, 2007 and December 31, 2006 as a result of this
subsidy. A reduction in TDS' net periodic postretirement benefit cost
due to the anticipated receipt of the federal subsidy was recognized
beginning in 2006. The effect of the subsidy reduced TDS' fiscal 2007
and 2006 net periodic postretirement benefit cost by $2.7 million
and $2.6 million, respectively. As of December 31, 2007, TDS
had not received a Medicare subsidy in 2007, 2006 or 2005. During 2008
and 2009, TDS expects to receive Medicare subsidies of
$0.2 million and $0.3 million for 2006 and 2007,
respectively.
NOTE 18 COMMITMENTS AND CONTINGENCIES
Contingent
obligations not related to income taxes, including indemnities,
litigation and other possible commitments, are accounted for in
accordance with SFAS 5, which requires that an estimated loss be
recorded if it is probable that an asset has been impaired or a
liability has been incurred at the date of the financial statements and
the amount of the loss can be reasonably estimated. Accordingly, those
contingencies that are deemed to be probable and where the amount of
the loss is reasonably estimable are accrued in the financial
statements. If only a range of loss can be determined, the best
estimate within that range is accrued; if none of the estimates within
that range is better than another, the low end of the range is accrued.
Disclosure of a contingency is required if there is at least a
reasonable possibility that a loss has been or will be incurred, even
if the amount is not estimable. The assessment of contingencies is a
highly subjective process that requires judgments about future events.
Contingencies are reviewed at least quarterly to determine the adequacy
of accruals and related financial statement disclosures. The ultimate
outcomes of contingencies could differ materially from amounts accrued
in the financial statements.
Lease Commitments
TDS
and its subsidiaries have leases for certain plant facilities, office
space, retail sites, cell sites and data processing equipment, most of
which are classified as operating leases. Certain leases have renewal
options and/or fixed rental increases. Renewal options that are
reasonably assured of exercise are included in determining the lease
term. Any rent abatements or lease incentives, in addition to fixed
rental increases, are included in the calculation of rent expense and
calculated on a straight-line basis over the defined lease term.
TDS
accounts for certain lease agreements as capital leases. The short- and
long-term portions of capital lease obligations totaled
$0.5 million and $1.3 million, respectively, as of
December 31, 2007 and $1.6 million and $3.3 million,
respectively, as of December 31, 2006. The short- and long-term
portions of capital lease obligations are included in Other current
liabilities and Other deferred liabilities and credits, respectively,
in the Consolidated Balance Sheets.
For
the years 2007, 2006 and 2005, rent expense for noncancelable,
long-term leases was $147.4 million, $130.2 million and
$123.2 million, respectively, and rent expense under cancelable,
short-term leases was $12.8 million, $20.3 million and
$15.0 million, respectively. Rental revenue totaled
$23.8 million, $24.1 million and $15.4 million in 2007,
2006 and 2005, respectively. At December 31, 2007, the aggregate
minimum rental payments required and rental receipts expected under
noncancelable, long-term operating and capital leases were as follows:
|
|
Operating Leases–
Minimum Future
Rental Payments |
|
Operating Leases–
Minimum Future
Rental Receipts |
|
Capital Leases–
Minimum Future
Rental Payments |
|
| (Dollars in thousands) |
|
|
|
| 2008 |
|
|
$126,974 |
|
|
$ 22,825 |
|
|
$ 585 |
|
| 2009 |
|
|
111,423 |
|
|
20,604 |
|
|
270 |
|
| 2010 |
|
|
96,308 |
|
|
15,796 |
|
|
169 |
|
| 2011 |
|
|
79,726 |
|
|
10,107 |
|
|
174 |
|
| 2012 |
|
|
57,402 |
|
|
4,257 |
|
|
179 |
|
| Thereafter |
|
|
488,626 |
|
|
1,350 |
|
|
1,193 |
|
| Total |
|
|
$960,459 |
|
|
$ 74,939 |
|
|
2,570 |
|
| |
|
|
|
|
|
|
|
|
Less: Amounts representing interest |
|
|
(721 |
) |
| Present value of minimum lease payments |
|
|
1,849 |
|
| Less: Current portion of obligations under capital leases |
|
|
(509 |
) |
| Long-term portion of obligations under capital leases |
|
|
$1,340 |
|
Indemnifications
TDS
enters into agreements in the normal course of business that provide
for indemnification of counterparties. These agreements include certain
asset sales and financings with other parties. The term of the
indemnification varies by agreement. The events or circumstances that
would require TDS to perform under these indemnities are transaction
specific; however, these agreements may require TDS to indemnify the
counterparty for costs and losses incurred from litigation or claims
arising from the underlying transaction. TDS is unable to estimate the
maximum potential liability for these types of indemnifications as the
amounts are dependent on the outcome of future events, the nature and
likelihood of which cannot be determined at this time. Historically,
TDS has not made any significant indemnification payments under such
agreements.
Legal Proceedings
TDS
is involved or may be involved from time to time in legal proceedings
before the FCC, other regulatory authorities, and various state and
federal courts. The assessment of the expected outcomes of legal
proceedings is a highly subjective process that requires judgments
about future events. The legal proceedings are reviewed at least
quarterly to determine the adequacy of accruals and related financial
statement disclosures. The ultimate outcomes of legal proceedings could
differ materially from amounts accrued in the financial statements.
NOTE 19 MINORITY INTEREST IN SUBSIDIARIES
The
following table summarizes the minority shareholders' and partners'
interests in the equity of consolidated subsidiaries.
December 31,
|
|
2007 |
|
2006 |
| (Dollars in thousands) |
|
|
| U.S. Cellular public shareholders |
|
$ |
613,710 |
|
$ |
578,241 |
| Subsidiaries' partners and shareholders |
|
|
37,827 |
|
|
31,481 |
| |
|
$ |
651,537 |
|
$ |
609,722 |
Under SFAS No. 150, Accounting for Certain Financial Instruments with Characteristics of Both Liabilities and
Equity,
("SFAS 150") certain minority interests in consolidated entities
with finite lives may meet the standard's definition of a mandatorily
redeemable financial instrument and thus require reclassification as
liabilities and remeasurement at the estimated amount of cash that
would be due and payable to settle such minority interests under the
applicable entity's organization agreement assuming an orderly
liquidation of the finite-lived entity, net of estimated liquidation
costs (the "settlement value"). TDS' consolidated financial statements
include minority interests that meet the standard's definition of
mandatorily redeemable financial instruments. These mandatorily
redeemable minority interests represent interests held by third parties
in consolidated partnerships and limited liability companies ("LLCs"),
where the terms of the underlying partnership or LLC agreement
provide for a defined termination date at which time the assets of the
subsidiary are to be sold, the liabilities are to be extinguished and
the remaining net proceeds are to be distributed to the minority
interest holders and TDS in accordance with the respective partnership
and LLC agreements. The termination dates of TDS' mandatorily
redeemable minority interests range from 2042 to 2105.
The
settlement value of TDS' mandatorily redeemable minority interests was
estimated to be $187.9 million at December 31, 2007 and
$161.0 million at December 31, 2006. This represents the
estimated amount of cash that would be due and payable to settle
minority interests assuming an orderly liquidation of the finite-lived
consolidated partnerships and LLCs on December 31, 2007 and
2006, net of estimated liquidation costs. This amount is being
disclosed pursuant to the requirements of FSP No. FAS 150-3, Effective Date, Disclosures, and Transition for Mandatorily Redeemable Financial Instruments of Certain Nonpublic Entities and Certain Mandatorily Redeemable Noncontrolling Interests under SFAS 150.
TDS has no current plans or intentions to liquidate any of the related
partnerships or LLCs prior to their scheduled termination dates.
The corresponding carrying value of the minority interests in
finite-lived consolidated partnerships and LLCs at
December 31, 2007 and 2006 was $38.8 million and
$32.1 million, respectively, and is included in Minority Interest
in Subsidiaries in the Consolidated Balance Sheets. The excess of the
estimated aggregate settlement value over the aggregate carrying value
of the mandatorily redeemable minority interests was primarily due to
the unrecognized appreciation of the minority-interest holders' share
of the underlying net assets in the consolidated partnerships
and LLCs. Neither the minority-interest holders' share, nor TDS'
share, of the appreciation of the underlying net assets of these
subsidiaries is reflected in the consolidated financial statements
under U.S. GAAP. The estimate of settlement value was based on
certain factors and assumptions. Change in those factors and
assumptions could result in a materially larger or smaller settlement
amount.
NOTE 20 COMMON STOCKHOLDERS' EQUITY
Tax-Deferred Savings Plan
TDS
had reserved 45,000 Common Shares and 45,000 Special Common Shares at
December 31, 2007, for issuance under the TDS Tax-Deferred Savings
Plan, a qualified profit-sharing plan pursuant to Sections 401(a)
and 401(k) of the Internal Revenue Code. Participating employees have
the option of investing their contributions and TDS' contributions in a
TDS Common Share fund, a TDS Special Common Share fund, a
U.S. Cellular Common Share fund or certain unaffiliated funds.
Stock Dividend
On
February 17, 2005, the TDS Board of Directors unanimously
approved, and on April 11, 2005, the TDS shareholders approved an
amendment (the "Amendment") to the Restated Certificate of
Incorporation of TDS to increase the authorized number of Special
Common Shares of TDS from 20,000,000 to 165,000,000.
As
a result, and following the satisfaction of other conditions, the
distribution of TDS Special Common Shares became effective on
May 13, 2005 to shareholders of record on April 29, 2005. In
the distribution, one TDS Special Common Share was distributed in the
form of a stock dividend with respect to each TDS Common Share and TDS
Series A Common Share issued.
Common Stock
The
holders of Common Shares and Special Common Shares are entitled to one
vote per share. The holders of Common Shares have full voting rights,
the holders of Special Common Shares have limited voting rights. Other
than the election of directors, the Special Common Shares have no votes
except as otherwise required by law. The holders of Series A
Common Shares are entitled to ten votes per share. Series A Common
Shares are convertible, on a share for share basis, into Common Shares
or Special Common Shares. TDS has reserved 6,442,000 Common Shares and
6,580,000 Special Common Shares at December 31, 2007, for possible
issuance upon such conversion.
The
following table summarizes the number of Common, Special Common and Series A Common Shares outstanding.
|
|
Common
Shares |
|
Special
Common
Shares |
|
Common
Treasury
Shares |
|
Special
Common
Treasury
Shares |
|
Series A
Common
Shares |
|
| (Shares in thousands) |
|
|
|
| Balance December 31, 2004 |
|
56,377 |
|
– |
|
(5,362 |
) |
– |
|
6,421 |
|
| |
Conversion of Series A Common Shares |
|
4 |
|
– |
|
– |
|
– |
|
(4 |
) |
| |
Distribution of Special Common Shares |
|
– |
|
62,859 |
|
– |
|
(5,268 |
) |
– |
|
| |
Dividend reinvestment, incentive and compensation plans |
|
100 |
|
9 |
|
257 |
|
140 |
|
23 |
|
| Balance December 31, 2005 |
|
56,481 |
|
62,868 |
|
(5,105 |
) |
(5,128 |
) |
6,440 |
|
| |
Conversion of Series A Common and Preferred Series TT Shares |
|
2 |
|
– |
|
– |
|
– |
|
(2 |
) |
| |
|
Dividend reinvestment, incentive and compensation plans |
|
21 |
|
19 |
|
429 |
|
452 |
|
7 |
|
| |
Other |
|
54 |
|
54 |
|
– |
|
– |
|
– |
|
| Balance December 31, 2006 |
|
56,558 |
|
62,941 |
|
(4,676 |
) |
(4,676 |
) |
6,445 |
|
| |
Repurchase of Special Common Shares |
|
– |
|
– |
|
– |
|
(2,077 |
) |
– |
|
| |
Conversion of Series A Common Shares |
|
10 |
|
– |
|
– |
|
– |
|
(10 |
) |
| |
Dividend reinvestment, incentive and compensation plans |
|
13 |
|
5 |
|
1,243 |
|
2,041 |
|
7 |
|
| Balance December 31, 2007 |
|
56,581 |
|
62,946 |
|
(3,433 |
) |
(4,712 |
) |
6,442 |
|
Common Share Repurchase Program
On
March 2, 2007, the Board of Directors of TDS authorized the
repurchase of up to $250 million of TDS Special Common Shares from
time to time through open market purchases, block transactions, private
purchases or otherwise. The authorization will expire March 2,
2010. As of December 31, 2007, TDS repurchased 2,076,979 Special
Common Shares for $126.7 million, or an average of $60.99 per
share pursuant to this authorization. TDS did not repurchase any common
shares in 2006 and 2005.
The
Board of Directors of U.S. Cellular has authorized the repurchase
of up to 1% of the outstanding U.S. Cellular Common Shares held by
non-affiliates on a quarterly basis, primarily for use in employee
benefit plans (the "Limited Authorization"). This authorization does
not have an expiration date.
On
March 6, 2007, the Board of Directors of U.S. Cellular
authorized the repurchase of up to 500,000 Common Shares of
U.S. Cellular (the "Additional Authorization") from time to time
through open market purchases, block transactions, private transactions
or other methods. This authorization was in addition to
U.S. Cellular's existing Limited Authorization discussed above,
and was scheduled to expire on March 6, 2010. However, because
this authorization was fully utilized in connection with the
April 4, 2007 accelerated share repurchases discussed below, no
further purchases are available under this authorization.
U.S. Cellular
entered into accelerated share repurchase ("ASR") agreements to
purchase its shares through an investment banking firm in private
transactions. The repurchased shares are held as treasury shares. In
connection with each ASR, the investment banking firm purchased an
equivalent number of shares in the open-market over time. Each program
was required to be completed within two years of the trade date of the
respective ASR. At the end of each program, U.S. Cellular received
or paid a price adjustment based on the average price of shares
acquired by the investment banking firm pursuant to the ASR during the
purchase period, less a negotiated discount. The purchase price
adjustment could be settled, at U.S. Cellular's option, in cash or
in U.S. Cellular Common Shares.
Activity
related to U.S. Cellular's repurchases of shares through ASR
transactions on April 4, July 10 and October 25, 2007,
and its obligations to the investment banking firm, are detailed in the
table below.
|
|
April 4,
2007 |
|
July 10,
2007 |
|
October 25,
2007 |
|
Totals |
|
(Dollars in thousands, except per share amounts)
|
|
|
|
| Number of Shares Repurchased by U.S. Cellular(1) |
|
|
670,000 |
|
|
168,000 |
|
|
168,000 |
|
|
1,006,000 |
|
| |
Initial purchase price to investment banking firm |
|
$ |
49,057 |
|
$ |
16,145 |
|
$ |
16,215 |
|
$ |
81,417 |
|
| |
Weighted average price of initial purchase(2) |
|
$ |
73.22 |
|
$ |
96.10 |
|
$ |
96.52 |
|
$ |
80.93 |
|
ASR Settled as of December 31, 2007(3) |
|
|
|
|
|
|
|
|
|
|
|
|
|
| |
Additional amount paid to investment banking firm |
|
$ |
6,485 |
|
|
– |
|
|
– |
|
$ |
6,485 |
|
| |
Final total cost of shares |
|
$ |
55,542 |
|
|
– |
|
|
– |
|
$ |
55,542 |
|
| |
Final weighted average price |
|
$ |
82.90 |
|
|
– |
|
|
– |
|
$ |
82.90 |
|
| |
Number of shares purchased by investment banking firm and settled |
|
|
670,000 |
|
|
– |
|
|
– |
|
|
670,000 |
|
Number of Shares Purchased by Investment Banking Firm for Open ASRs (As of December 31, 2007) |
|
|
– |
|
|
63,665 |
|
|
– |
|
|
63,665 |
|
| |
|
Average price of shares, net of discount, purchased by investment banking firm |
|
|
– |
|
$ |
85.70 |
|
|
– |
|
$ |
85.70 |
|
| |
|
(Refund due) from investment banking firm for shares purchased through December 31, 2007(4) |
|
|
– |
|
$ |
(661 |
) |
|
– |
|
$ |
(661 |
) |
| |
|
Equivalent number of shares that would be delivered by investment banking firm based on December 31, 2007 closing price(5) |
|
|
– |
|
|
7,861 |
|
|
– |
|
|
7,861 |
|
Settlement of ASRs Subsequent to December 31, 2007(6) |
|
|
|
|
|
|
|
|
|
|
|
|
|
| |
(Refund) paid by investment banking firm |
|
|
– |
|
$ |
(2,080 |
) |
$ |
(2,474 |
) |
$ |
(4,554 |
) |
| |
Final total cost of shares, less discount plus commission |
|
|
– |
|
$ |
14,065 |
|
$ |
13,741 |
|
$ |
27,806 |
|
| |
Final weighted average price(2) |
|
|
– |
|
$ |
83.72 |
|
$ |
81.79 |
|
$ |
82.76 |
|
TDS'
ownership percentage of U.S. Cellular increases upon such
U.S. Cellular share repurchases. Therefore, TDS accounts for
U.S. Cellular's purchases of U.S. Cellular Common Shares as
step acquisitions using purchase accounting. All of the ASRs were
settled in cash and resulted in an adjustment to TDS' capital in excess
of par value upon the respective settlements. These step acquisitions
caused TDS to increase its balances of Licenses, Goodwill and Customer
Lists. See Note 8–Licenses and Goodwill and Note 9–Customer
Lists for the amounts allocated to each of these asset groups. No
U.S. Cellular Common Shares were repurchased in 2006 and 2005.
Accumulated Other Comprehensive Income
The
changes in the cumulative balance of accumulated other comprehensive
income are as follows:
|
|
2007 |
|
2006 |
|
| (Dollars in thousands) |
|
|
|
| Marketable Equity Securities |
|
|
|
|
|
|
|
| Balance, beginning of year |
|
$ |
749,978 |
|
$ |
578,273 |
|
| Add (deduct): |
|
|
|
|
|
|
|
| |
Unrealized gains on marketable equity securities |
|
|
351,648 |
|
|
290,112 |
|
| |
Deferred Income tax (expense) |
|
|
(129,665 |
) |
|
(110,973 |
) |
| |
|
|
221,983 |
|
|
179,139 |
|
| |
|
Unrealized gain (loss) of equity method companies |
|
|
35 |
|
|
(190 |
) |
| |
|
Minority share of unrealized (gains) |
|
|
(2,549 |
) |
|
(7,244 |
) |
| Net change in unrealized gains on marketable equity securities |
|
|
219,469 |
|
|
171,705 |
|
| |
|
Recognized (gain) on sale of marketable equity securities |
|
|
(551,823 |
) |
|
– |
|
| |
|
Income tax expense |
|
|
201,861 |
|
|
– |
|
| |
|
|
(349,962 |
) |
|
– |
|
| |
|
Minority Share of Income |
|
|
15,586 |
|
|
– |
|
| |
Net recognized (gain) on sale of marketable equity securities |
|
|
(334,376 |
) |
|
– |
|
| Net change in marketable equity securities |
|
|
(114,907 |
) |
|
171,705 |
|
| Application of FIN 48 |
|
|
30,306 |
|
|
– |
|
| Balance, end of year |
|
$ |
665,377 |
|
$ |
749,978 |
|
Derivative Instruments |
|
|
|
|
|
|
|
| Balance, beginning of year |
|
$ |
(215,122 |
) |
$ |
(214,632 |
) |
| Add (deduct): |
|
|
|
|
|
|
|
| |
Deferred income tax (expense) benefit |
|
|
223 |
|
|
(473 |
) |
| |
Minority share of unrealized (gains) |
|
|
– |
|
|
(17 |
) |
| |
Net change in unrealized gains (losses) on derivative instruments |
|
|
223 |
|
|
(490 |
) |
| |
|
Recognized loss on settlement of derivative instruments |
|
|
125,121 |
|
|
– |
|
| |
|
Income tax (benefit) |
|
|
(45,771 |
) |
|
– |
|
| |
|
|
79,350 |
|
|
– |
|
| |
|
Minority share of income |
|
|
549 |
|
|
– |
|
| |
Net recognized loss on settlement of derivatives |
|
|
79,899 |
|
|
– |
|
| Net change in derivative instruments |
|
|
80,122 |
|
|
(490 |
) |
| Application of FIN 48 |
|
|
(9,583 |
) |
|
– |
|
| Balance, end of year |
|
$ |
(144,583 |
) |
$ |
(215,122 |
) |
Retirement Plans |
|
|
|
|
|
|
|
| |
Balance, beginning of year |
|
$ |
(12,743 |
) |
$ |
– |
|
| |
Add (deduct): |
|
|
|
|
|
|
|
| |
|
Amounts included in net periodic benefit cost for the period |
|
|
|
|
|
|
|
| |
|
|
Actuarial gain |
|
|
5,462 |
|
|
– |
|
| |
|
|
Amortization of prior service cost |
|
|
(830 |
) |
|
– |
|
| |
|
|
Amortization of unrecognized net loss |
|
|
1,362 |
|
|
– |
|
| |
|
|
5,994 |
|
|
– |
|
| |
|
Deferred income tax (expense) |
|
|
(2,591 |
) |
|
– |
|
| |
|
Additional liability of defined benefit pension plan |
|
|
– |
|
|
(322 |
) |
| |
|
Termination of defined benefit pension plan |
|
|
322 |
|
|
– |
|
| |
Net change in retirement plans included in comprehensive income |
|
|
3,725 |
|
|
(322 |
) |
| |
Initial application of provisions of SFAS 158 on post-retirement pension plan, net of tax |
|
|
– |
|
|
(12,421 |
) |
| |
Net change due to initial application of SFAS 158 included in comprehensive income |
|
|
– |
|
|
(12,421 |
) |
| |
Balance, end of year |
|
$ |
(9,018 |
) |
$ |
(12,743 |
) |
Accumulated Other Comprehensive Income |
|
|
|
|
|
|
|
| Balance, beginning of year |
|
$ |
522,113 |
|
$ |
363,641 |
|
| |
Net change in marketable equity securities |
|
|
(114,907 |
) |
|
171,705 |
|
| |
Net change in derivative instruments |
|
|
80,122 |
|
|
(490 |
) |
| |
Net change in retirement plans |
|
|
3,725 |
|
|
(322 |
) |
| |
Net change included in comprehensive income |
|
|
(31,060 |
) |
|
170,893 |
|
| |
Application of FIN 48 |
|
|
20,723 |
|
|
– |
|
| |
Net change due to application of SFAS 158 |
|
|
– |
|
|
(12,421 |
) |
| |
Net change in accumulated comprehensive income |
|
|
(10,337 |
) |
|
158,472 |
|
| Balance, end of year |
|
$ |
511,776 |
|
$ |
522,113 |
|
NOTE 21 PREFERRED SHARES
The
holders of outstanding Preferred Shares are entitled to one vote per
share. TDS had 8,603 and 8,627 Cumulative Preferred Shares ($100 per
share stated value) authorized, issued and outstanding at
December 31, 2007 and 2006, respectively. At December 31,
2007 and 2006, no Preferred Shares were convertible at the option of
the holder. A holder converted 30,000 Preferred Shares into 54,540 TDS
Common Shares and Special Common Shares on November 9, 2006. The
Common and Special Common Shares issued had an aggregate fair value of
$5.4 million on the date of conversion. Preferred Shares totaling
8,228 are redeemable at the option of TDS for 4.35 U.S. Cellular
common shares or equivalent value in cash or TDS Common Shares. The
remaining Preferred Shares are not redeemable. The average dividend
rate was $6.04 and $5.23 per share in 2007 and 2006, respectively.
The
following is a schedule of Preferred Shares activity:
Year Ended December 31,
|
|
2007 |
|
2006 |
|
| (Dollars in thousands) |
|
|
|
| Balance, beginning of year |
|
$ |
863 |
|
$ |
3,863 |
|
| Less: |
|
|
|
|
|
|
|
| |
Conversion of preferred |
|
|
– |
|
|
(3,000 |
) |
| |
Repurchase of preferred |
|
|
(3 |
) |
|
– |
|
| Balance, end of year |
|
$ |
860 |
|
$ |
863 |
|
NOTE 22 STOCK-BASED COMPENSATION
TDS Consolidated
As
a result of adopting SFAS 123(R) on January 1, 2006, TDS'
income from continuing operations before income taxes and minority
interest was $19.0 million and $30.6 million lower in 2007
and 2006, respectively, than if it had continued to account for
stock-based compensation under APB 25. Similarly, as a result of
adopting SFAS 123(R) on January 1, 2006, TDS' net income was
$11.1 million and $17.6 million lower in 2007 and 2006,
respectively, its basic earnings per share for was $0.09 and $0.15
lower in 2007 and 2006, respectively, and its diluted earnings per
share was $0.09 and $0.15 lower in 2007 and 2006, respectively, than if
TDS had continued to account for stock-based compensation expense under
APB 25.
For
comparison, the following table illustrates the pro forma effect on net
income and earnings per share had TDS applied the fair value
recognition provisions of SFAS 123(R) to its stock-based employee
compensation plans 2005:
(Dollars in thousands, except per share amounts)
|
|
|
|
| Net income, as reported |
|
$ |
647,740 |
|
| Add: Stock-based compensation expense included in reported net income, net of related tax effects and minority interest |
|
|
4,534 |
|
| Deduct:
Stock-based compensation expense determined under fair value based
method for all awards, net of related tax effects and minority interest |
|
|
(25,250 |
) |
| Pro forma net income |
|
$ |
627,024 |
|
Earnings per share: |
|
|
|
|
| Basic–as reported |
|
$ |
5.62 |
|
| Basic–pro forma |
|
$ |
5.44 |
|
| Diluted–as reported |
|
$ |
5.57 |
|
| Diluted–pro forma |
|
$ |
5.40 |
|
Prior
to the adoption of SFAS 123(R), TDS presented all tax benefits
resulting from tax deductions associated with the exercise of stock
options by employees as cash flows from operating activities in the
Consolidated Statements of Cash Flows. SFAS 123(R) requires that
"excess tax benefits" be classified as cash flows from financing
activities in the Consolidated Statements of Cash Flows. For this
purpose, the excess tax benefits are tax benefits related to the
difference between the total tax deduction associated with the exercise
of stock options by employees and the amount of compensation cost
recognized for those options. For the years ended December 31,
2007 and 2006, excess tax benefits of $29.0 million and
$5.1 million were included in cash flows from financing activities
pursuant to the requirement of SFAS 123(R).
The
following table summarizes stock-based compensation expense recognized during 2007 and 2006:
Year Ended December 31,
|
|
2007 |
|
2006 |
|
(Amounts in thousands)
|
|
|
|
| Stock option awards |
|
$ |
18,961 |
|
$ |
30,630 |
|
| Restricted stock unit awards |
|
|
12,400 |
|
|
13,025 |
|
| Deferred compensation matching stock unit awards |
|
|
155 |
|
|
(742 |
) |
| Employee stock purchase plans |
|
|
229 |
|
|
87 |
|
| Awards under non-employee director's compensation plan |
|
|
146 |
|
|
406 |
|
| Total stock-based compensation, before income taxes |
|
|
31,891 |
|
|
43,406 |
|
| Income tax benefit |
|
|
(11,783 |
) |
|
(16,588 |
) |
| Total stock-based compensation expense, net of income taxes |
|
$ |
20,108 |
|
$ |
26,818 |
|
At
December 31, 2007, unrecognized compensation cost for all
stock-based compensation awards was $19.2 million. The
unrecognized compensation cost for stock-based compensation awards at
December 31, 2007 is expected to be recognized over a weighted
average period of 1.6 years.
Stock
based compensation expense totaled $31.9 million and
$43.4 million for 2007 and 2006, respectively. Of these amounts,
$30.0 million and $41.1 million was recorded in Selling,
general and administrative expense and $1.9 million and
$2.3 million was recorded in cost of services and products.
TDS (excluding U.S. Cellular)
The
information in this section relates to stock-based compensation plans
using the equity instruments of TDS. Participants in these plans are
generally employees of TDS Corporate and TDS Telecom, although
U.S. Cellular employees are eligible to participate in the TDS
Employee Stock Purchase Plan. Information related to plans using the
equity instruments of U.S. Cellular are shown in the
U.S. Cellular section following the TDS section.
Under
the TDS 2004 Long-Term Incentive Plan (and a predecessor plan), TDS may
grant fixed and performance-based incentive and non-qualified stock
options, restricted stock, restricted stock units, and deferred
compensation stock unit awards to key employees. TDS had reserved
2,003,000 Common Shares and 9,386,000 Special Common Shares at
December 31, 2007, for equity awards granted and to be granted
under this plan. At December 31, 2007, the only types of awards
outstanding are fixed non-qualified stock option awards, restricted
stock unit awards, and deferred compensation stock unit awards. As of
December 31, 2007, TDS also had reserved 302,000 Special Common
Shares under an employee stock purchase plan. The maximum number of TDS
Common Shares and TDS Special Common Shares that may be issued to
employees under all stock-based compensation plans in effect at
December 31, 2007 was 2,003,000 and 9,688,000 shares,
respectively. TDS has also created a Non-Employee Directors' Plan under
which it has reserved 66,000 Special Common Shares of TDS stock for
issuance as compensation to members of the board of directors who are
not employees of TDS. When shares are issued upon stock option exercise
or restricted stock unit vesting, TDS uses treasury shares.
Stock
Options–Stock options granted to key employees are exercisable over a
specified period not in excess of ten years. Stock options generally
vest over periods up to four years from the date of grant. Stock
options outstanding at December 31, 2007 expire between 2008 and
2017. However, vested stock options typically expire 30 days after
the effective date of an employee's termination of employment for
reasons other than retirement. Employees who leave at the age of
retirement have 90 days (or one year if they satisfy certain
requirements) within which to exercise their vested stock options. The
exercise price of the option generally equals the market value of TDS
common stock on the date of grant.
TDS
granted 873,000, 1,447,000 and 630,000 stock options during 2007, 2006
and 2005, respectively. TDS estimates the fair value of stock options
granted using the Black-Scholes valuation model. The fair value is then
recognized as compensation cost on a straight-line basis over the
requisite service period, which is generally the vesting period, for
each separately vesting portion of the awards as if the awards were,
in-substance, multiple awards, which is the same attribution method
that was used by TDS for purposes of its pro forma disclosures under
SFAS 123. TDS used the assumptions shown in the table below in
valuing the options granted in 2007, 2006 and 2005:
|
|
2007 |
|
2006 |
|
2005 |
| Expected Life |
|
4.0 Years |
|
4.9 Years |
|
4.9 Years |
| Expected Annual Volatility Rate |
|
19.5% |
|
25.9% |
|
30.8% |
| Dividend Yield |
|
0.7% |
|
0.7% - 1.0% |
|
0.9% |
| Risk-free Interest Rate |
|
4.7% |
|
3.9% - 4.8% |
|
3.8% |
| Estimated Annual Forfeiture Rate |
|
1.0% |
|
0.6% |
|
0.7% |
Any
employee with stock options granted prior to the distribution of the
TDS Special Common Share Dividend on May 13, 2005, more fully
described in Note 20–Common Stockholders' Equity, receives one
Common Share and one Special Common Share per tandem option exercised.
Each tandem option is exercisable at its original exercise price. TDS
options granted after the distribution of the TDS Special Common Share
Dividend will receive one Special Common Share per option exercised.
A
summary of TDS stock options (total and portion exercisable) and
changes during the three years ended December 31, 2007, is
presented in the table and narrative below:
Tandem Options
|
|
Number of
Tandem
Options(1) |
|
Weighted
Average
Exercise
Prices |
|
Weighted
Average
Grant Date
Fair Value |
|
Aggregate
Intrinsic
Value |
| Stock options: |
|
|
|
|
|
|
|
|
|
|
|
| Outstanding at December 31, 2004 |
|
2,331,000 |
|
$ |
70.76 |
|
|
|
|
|
|
| (1,791,000 exercisable) |
|
|
|
|
|
|
|
|
|
|
|
| |
Granted |
|
630,000 |
|
|
77.63 |
|
$ |
23.78 |
|
|
|
| |
Exercised |
|
(228,000 |
) |
|
51.91 |
|
|
|
|
$ |
6,375,000 |
| |
Forfeited |
|
(32,000 |
) |
|
83.71 |
|
|
|
|
|
|
| |
Expired |
|
– |
|
|
– |
|
|
|
|
|
|
| Outstanding at December 31, 2005 |
|
2,701,000 |
|
$ |
73.86 |
|
|
|
|
|
|
| (2,461,000 exercisable) |
|
|
|
|
|
|
|
|
|
|
|
| |
Granted |
|
– |
|
$ |
– |
|
$ |
– |
|
|
|
| |
Exercised |
|
(415,000 |
) |
|
58.45 |
|
|
|
|
$ |
14,313,000 |
| |
Forfeited |
|
(17,000 |
) |
|
59.23 |
|
|
|
|
|
|
| |
Expired |
|
(15,000 |
) |
|
105.47 |
|
|
|
|
|
|
| Outstanding at December 31, 2006 |
|
2,254,000 |
|
$ |
76.59 |
|
|
|
|
|
|
| (2,193,000 exercisable) |
|
|
|
|
|
|
|
|
|
|
|
| |
Granted |
|
– |
|
$ |
– |
|
$ |
– |
|
|
|
| |
Exercised |
|
(1,205,000 |
) |
|
74.21 |
|
|
|
|
$ |
58,233,000 |
| |
Forfeited |
|
(1,000 |
) |
|
65.96 |
|
|
|
|
|
|
| |
Expired |
|
(11,000 |
) |
|
77.69 |
|
|
|
|
|
|
| Outstanding at December 31, 2007 |
|
1,037,000 |
|
$ |
79.25 |
|
|
|
|
$ |
42,562,000 |
| (1,037,000 exercisable) |
|
|
|
|
|
|
|
|
|
$ |
42,562,000 |
|
|
Options Outstanding |
|
Options Exercisable |
Range of Exercise Prices
|
|
Number
Outstanding at
December 31,
2007 |
|
Weighted
Average
Remaining
Contractual
Life
(in years) |
|
Weighted
Average
Exercise
Price |
|
Number
Exercisable at
December 31,
2007 |
|
Weighted
Average
Remaining
Contractual
Life
(in years) |
|
Weighted
Average
Exercise
Price |
| $33.87 - $49.99 |
|
75,000 |
|
2.8 |
|
$ |
41.38 |
|
75,000 |
|
2.8 |
|
$ |
41.38 |
| $50.00 - $74.99 |
|
411,000 |
|
5.0 |
|
|
61.23 |
|
411,000 |
|
5.0 |
|
|
61.23 |
| $75.00 - $99.99 |
|
288,000 |
|
6.3 |
|
|
83.05 |
|
288,000 |
|
6.3 |
|
|
83.05 |
| $100.00 - $127.00 |
|
263,000 |
|
2.6 |
|
|
114.01 |
|
263,000 |
|
2.6 |
|
|
114.01 |
| |
|
1,037,000 |
|
4.6 |
|
$ |
79.25 |
|
1,037,000 |
|
4.6 |
|
$ |
79.25 |
Special Common Share Options
|
|
Number of
Options(2) |
|
Weighted
Average
Exercise
Prices |
|
Weighted
Average
Grant Date
Fair Value |
|
Aggregate
Intrinsic
Value |
| Stock options: |
|
|
|
|
|
|
|
|
|
|
|
| Outstanding at December 31, 2005 |
|
– |
|
$ |
– |
|
|
|
|
|
|
| |
Granted |
|
1,447,000 |
|
|
40.07 |
|
$ |
11.51 |
|
|
|
| |
Exercised |
|
(31,000 |
) |
|
38.00 |
|
|
|
|
$ |
374,000 |
| |
Forfeited |
|
(14,000 |
) |
|
38.00 |
|
|
|
|
|
|
| Outstanding at December 31, 2006 |
|
1,402,000 |
|
$ |
40.15 |
|
|
|
|
|
|
| (1,400,000 exercisable) |
|
|
|
|
|
|
|
|
|
|
|
| |
Granted |
|
873,000 |
|
$ |
59.45 |
|
$ |
13.20 |
|
|
|
| |
Exercised |
|
(824,000 |
) |
|
38.59 |
|
|
|
|
$ |
16,543,000 |
| |
Forfeited |
|
(4,000 |
) |
|
59.45 |
|
|
|
|
|
|
| Outstanding at December 31, 2007 |
|
1,447,000 |
|
$ |
52.63 |
|
|
|
|
$ |
8,807,000 |
| (1,446,000 exercisable) |
|
|
|
|
|
|
|
|
|
$ |
8,795,000 |
|
|
Options Outstanding |
|
Options Exercised |
Range of Exercise Prices
|
|
Number
Outstanding at
December 31,
2007 |
|
Weighted
Average
Remaining
Contractual
Life
(in years) |
|
Weighted
Average
Exercise
Price |
|
Number
Exercisable at
December 31,
2007 |
|
Weighted
Average
Remaining
Contractual
Life
(in years) |
|
Weighted
Average
Exercise
Price |
| $38.00 - $39.99 |
|
365,000 |
|
8.5 |
|
$ |
38.01 |
|
364,000 |
|
8.5 |
|
$ |
38.01 |
| $40.00 - $49.99 |
|
213,000 |
|
9.0 |
|
|
49.80 |
|
213,000 |
|
9.0 |
|
|
49.80 |
| $50.00 - $59.99 |
|
869,000 |
|
9.5 |
|
|
59.45 |
|
869,000 |
|
9.5 |
|
|
59.45 |
| |
|
1,447,000 |
|
9.2 |
|
$ |
52.63 |
|
1,446,000 |
|
9.2 |
|
$ |
52.63 |
The
aggregate intrinsic value in the tables above represents the total
pretax intrinsic value (the difference between TDS' closing stock
prices and the exercise price, multiplied by the number of in-the-money
options) that was received by the option holders upon exercise or that
would have been received by option holders had all options been
exercised on December 31, 2007. TDS received $84.8 million
and $28.8 million in cash from the issuance of Tandem and Special
Common shares for benefit plans, respectively, during 2007.
A
summary of TDS' nonvested stock options at December 31, 2007 and
changes during the year ended is presented in the tables below:
Tandem Options
|
|
Number(1) |
|
Weighted Average
Grant Date
Fair Values |
| Nonvested at December 31, 2006 |
|
61,000 |
|
$ |
25.55 |
| |
Granted |
|
– |
|
|
– |
| |
Vested |
|
(60,000 |
) |
|
25.55 |
| |
Forfeited |
|
(1,000 |
) |
|
25.55 |
| Nonvested at December 31, 2007 |
|
– |
|
$ |
– |
Special Common Share Options
|
|
Number(2) |
|
Weighted Average
Grant Date
Fair Values |
| Nonvested at December 31, 2006 |
|
2,000 |
|
$ |
11.18 |
| |
Granted |
|
873,000 |
|
|
13.20 |
| |
Vested |
|
(870,000 |
) |
|
13.20 |
| |
Forfeited |
|
(4,000 |
) |
|
13.20 |
| Nonvested at December 31, 2007 |
|
1,000 |
|
$ |
11.18 |
Restricted
Stock Units–Beginning in April 2005, TDS granted restricted stock unit
awards to key employees. These awards generally vest after three years.
All TDS tandem restricted stock units outstanding at December 31,
2006 were granted prior to the distribution of the TDS Special Common
Share Dividend in 2005. As a result of the Special Common Share
Dividend, an employee will receive one Common Share and one Special
Common Share upon the vesting of such restricted stock units. The
tandem restricted stock unit awards granted in 2005 and outstanding at
December 31, 2006 vested in December 2007. On vesting, employees
received an equal number of TDS Common Shares and TDS Special Common
Shares with respect to such tandem restricted stock units. Each
restricted stock unit granted after the distribution of the TDS Special
Common Share Dividend in 2005 is convertible into one Special Common
Share upon the vesting of such restricted stock units. The restricted
stock unit awards granted in 2006 and 2007 will vest in December 2008
and 2009, respectively.
TDS
estimates the fair value of restricted stock units based on the closing
market price of TDS shares on the date of grant. The fair value is then
recognized as compensation cost on a straight-line basis over the
requisite service periods of the awards, which is generally the vesting
period.
A
summary of TDS nonvested restricted stock units at December 31,
2007 and changes during the year ended is presented in the table that
follows:
Tandem Restricted Stock Units
|
|
Number(1) |
|
Weighted Average
Grant Date
Fair Values |
| Nonvested at December 31, 2006 |
|
80,000 |
|
$ |
77.57 |
| |
Granted |
|
– |
|
|
– |
| |
Vested |
|
(77,000 |
) |
|
77.57 |
| |
Forfeited |
|
(3,000 |
) |
|
77.48 |
| Nonvested at December 31, 2007 |
|
– |
|
$ |
– |
Special Common Restricted Stock Units
|
|
Number(2) |
|
Weighted Average
Grant Date
Fair Values |
| Nonvested at December 31, 2006 |
|
125,000 |
|
$ |
40.04 |
| |
Granted |
|
93,000 |
|
|
59.45 |
| |
Vested |
|
(19,000 |
) |
|
38.12 |
| |
Forfeited |
|
(5,000 |
) |
|
40.27 |
| Nonvested at December 31, 2007 |
|
194,000 |
|
$ |
49.56 |
The
total fair values of restricted stock units vested during the years
ended December 31, 2007 and 2006 were $10,914,000 and $74,000,
respectively. No restricted stock units vested for the year ended
December 31, 2005.
Deferred
Compensation Stock Units–Certain TDS employees may elect to defer
receipt of all or a portion of their annual bonuses and to receive
stock unit matches on the amount deferred up to $400,000. Deferred
compensation, which is immediately vested, is deemed to be invested in
TDS Common Share units or, at the election of the committee that
administers the plan after the TDS Special Common Share Dividend in
2005, TDS Special Common Share units. TDS match amounts depend on the
amount of annual bonus that is deferred into stock units. Participants
receive a 25% stock unit match for amounts deferred up to 50% of their
total annual bonus and a 33% match for amounts that exceed 50% of their
total annual bonus. The matched stock units vest ratably at a rate of
one-third per year over three years. When fully vested and upon
distribution, employees will receive the vested TDS Common Shares
and/or TDS Special Common Shares, as applicable.
TDS
estimates the fair value of deferred compensation matching stock units
based on the closing market price of TDS shares on the date of grant.
The fair value of the matched stock units is then recognized as
compensation cost on a straight-line basis over the requisite service
periods of the awards, which is generally the vesting period.
Nonvested
deferred compensation stock units represent matched stock units
discussed above. A summary of TDS nonvested deferred compensation stock
units at December 31, 2007 and changes during the year ended is
presented in the table that follows:
Tandem Deferred Compensation Stock Units
|
|
Number(1) |
|
Weighted Average
Grant Date
Fair Values |
| Nonvested at December 31, 2006 |
|
295 |
|
$ |
81.53 |
| |
Granted |
|
– |
|
|
– |
| |
Vested |
|
(295 |
) |
|
81.53 |
| |
Forfeited |
|
– |
|
|
– |
| Nonvested at December 31, 2007 |
|
– |
|
$ |
– |
Special Common Deferred Compensation Stock Units
|
|
Number(2) |
|
Weighted Average
Grant Date
Fair Values |
| Nonvested at December 31, 2006 |
|
1,400 |
|
$ |
41.37 |
| |
Granted |
|
1,700 |
|
|
52.58 |
| |
Vested |
|
(1,300 |
) |
|
46.38 |
| |
Forfeited |
|
– |
|
|
– |
| Nonvested at December 31, 2007 |
|
1,800 |
|
$ |
48.30 |
Employee
Stock Purchase Plan–Under the 2003 Employee Stock Purchase Plan,
eligible employees of TDS and its subsidiaries may purchase a limited
number of shares of TDS common stock on a quarterly basis. Prior to
2006, such common stock consisted of TDS Common Shares. Beginning in
2006, such common stock consisted of TDS Special Common Shares. TDS had
reserved 302,000 Special Common Shares at December 31, 2007 for
issuance under this plan. The plan became effective on April 1,
2003 and will terminate on December 31, 2008. The per share cost
to each participant is 85% of the market value of the Common Shares or
Special Common Shares as of the issuance date. Under SFAS 123(R),
the employee stock purchase plan is considered a compensatory plan;
therefore recognition of compensation costs for stock issued under this
plan is required. Compensation cost is measured as the difference
between the cost of the shares to the plan participants and the fair
market value of the shares on the date of issuance. For the years ended
December 31, 2007 and 2006, the Company recognized compensation
expense of $105,000 and $48,000, respectively, related to this plan.
Compensation
of Non-Employee Directors–TDS issued 3,500 Special Common Shares under
its Non-Employee Directors' plan in 2007. TDS issued 2,600 Common
Shares and 5,900 Special Common Shares under its Non-Employee
Directors' plan in 2006.
Dividend
Reinvestment Plans–TDS had reserved 161,000 Common Shares and 319,000
Special Common Shares at December 31, 2007, for issuance under
Automatic Dividend Reinvestment and Stock Purchase Plans and 42,000
Series A Common Shares for issuance under the Series A Common
Share Automatic Dividend Reinvestment Plan. These plans enable holders
of TDS' Common Shares, Special Common Shares and Preferred Shares to
reinvest cash dividends in Common Shares and Special Common Shares and
holders of Series A Common Shares to reinvest cash dividends in
Series A Common Shares. The purchase price of the shares is 95% of
the market value, based on the average of the daily high and low sales
prices for TDS' Common Shares and Special Common Shares on the American
Stock Exchange for the ten trading days preceding the date on which the
purchase is made. Under SFAS 123(R) and SFAS 123, these plans
are considered non-compensatory plans, therefore no compensation
expense is recognized for stock issued under these plans.
U.S. Cellular
The
information in this section relates to stock-based compensation plans
using the equity instruments of U.S. Cellular. Participants in
these plans are employees of U.S. Cellular. U.S. Cellular
employees are also eligible to participate in the TDS Employee Stock
Purchase Plan. Information related to plans using the equity
instruments of TDS are shown in the previous section.
U.S. Cellular
has established the following stock-based compensation plans: a
long-term incentive plan, an employee stock purchase plan, and a
non-employee director compensation plan.
Under
the U.S. Cellular 2005 Long-Term Incentive Plan,
U.S. Cellular may grant fixed and performance-based incentive and
non-qualified stock options, restricted stock, restricted stock units,
and deferred compensation stock unit awards to key employees. At
December 31, 2007, the only types of awards outstanding are fixed
non-qualified stock option awards, restricted stock unit awards, and
deferred compensation stock unit awards.
At
December 31, 2007, U.S. Cellular had reserved 4,019,000
Common Shares for equity awards granted and to be granted under the
long-term incentive plan, and also had reserved 97,000 Common Shares
for issuance to employees under an employee stock purchase plan. The
maximum number of U.S. Cellular Common Shares that may be issued
to employees under all stock-based compensation plans in effect at
December 31, 2007 was 4,116,000. U.S. Cellular currently uses
treasury stock to satisfy stock option exercises, issuances under its
employee stock purchase plan, restricted stock unit awards and deferred
compensation stock unit awards.
U.S. Cellular
also has established a Non-Employee Director Compensation Plan under
which it has reserved 3,100 Common shares of U.S. Cellular stock
for issuance as compensation to members of the board of directors who
are not employees of U.S. Cellular or TDS.
Stock
Options–Stock options granted to key employees are exercisable over a
specified period not in excess of ten years. Stock options generally
vest over periods up to four years from the date of grant. Stock
options outstanding at December 31, 2007 expire between 2008 and
2017. However, vested stock options typically expire 30 days after
the effective date of an employee's termination of employment for
reasons other than retirement. Employees who leave at the age of
retirement have 90 days (or one year if they satisfy certain
requirements) within which to exercise their vested stock options. The
exercise price of the option generally equals the market value of
U.S. Cellular Common Shares on the date of grant.
U.S. Cellular
granted 477,000, 559,000 and 760,000 stock options during 2007, 2006
and 2005, respectively. U.S. Cellular estimates the fair value of
stock options granted using the Black-Scholes valuation model. The fair
value is then recognized as compensation cost on a straight-line basis
over the requisite service period, which is generally the vesting
period, for each separately vesting portion of the awards as if the
awards were, in-substance, multiple awards, which is the same
attribution method that was used by U.S. Cellular for purposes of
its pro forma disclosures under SFAS 123. U.S. Cellular used
the assumptions shown in the table below in valuing the options granted
in 2007, 2006 and 2005:
|
|
2007 |
|
2006 |
|
2005 |
| Expected Life |
|
3.1 Years |
|
3.0 Years |
|
3.0 Years |
| Expected Volatility |
|
22.5%–25.7% |
|
23.5%–25.2% |
|
36.5% |
| Dividend Yield |
|
0% |
|
0% |
|
0% |
| Risk-free Interest Rate |
|
3.3%–4.8% |
|
4.5%–4.7% |
|
3.9% |
| Estimated Annual Forfeiture Rate |
|
9.6% |
|
4.4% |
|
4.3% |
A
summary of U.S. Cellular stock options outstanding (total and
portion exercisable) and changes during the three years ended
December 31, 2007, is presented in the table below:
|
|
Number of
Options |
|
Weighted
Average
Exercise
Prices |
|
Weighted
Average
Grant Date
Fair Value |
|
Aggregate
Intrinsic Value |
| Stock options: |
|
|
|
|
|
|
|
|
|
|
|
| Outstanding at December 31, 2004 |
|
2,856,000 |
|
$ |
35.44 |
|
|
|
|
|
|
| (833,000 exercisable) |
|
|
|
|
|
|
|
|
|
|
|
| |
Granted |
|
760,000 |
|
|
45.68 |
|
$ |
13.38 |
|
|
|
| |
Exercised |
|
(693,000 |
) |
|
33.10 |
|
|
|
|
$ |
11,511,000 |
| |
Forfeited |
|
(185,000 |
) |
|
37.98 |
|
|
|
|
|
|
| |
Expired |
|
(37,000 |
) |
|
47.44 |
|
|
|
|
|
|
| Outstanding at December 31, 2005 |
|
2,701,000 |
|
$ |
38.80 |
|
|
|
|
|
|
| (885,000 exercisable) |
|
|
|
|
|
|
|
|
|
|
|
| |
Granted |
|
559,000 |
|
|
59.52 |
|
$ |
14.07 |
|
|
|
| |
Exercised |
|
(546,000 |
) |
|
34.55 |
|
|
|
|
$ |
14,324,000 |
| |
Forfeited |
|
(140,000 |
) |
|
41.50 |
|
|
|
|
|
|
| |
Expired |
|
(3,000 |
) |
|
40.90 |
|
|
|
|
|
|
| Outstanding at December 31, 2006 |
|
2,571,000 |
|
$ |
44.07 |
|
|
|
|
|
|
| (1,430,000 exercisable) |
|
|
|
|
|
|
|
|
|
|
|
| |
Granted |
|
477,000 |
|
|
74.29 |
|
$ |
16.74 |
|
|
|
| |
Exercised |
|
(1,523,000 |
) |
|
45.53 |
|
|
|
|
$ |
55,912,000 |
| |
Forfeited |
|
(122,000 |
) |
|
57.05 |
|
|
|
|
|
|
| |
Expired |
|
(4,000 |
) |
|
34.44 |
|
|
|
|
|
|
| Outstanding at December 31, 2007 |
|
1,399,000 |
|
$ |
51.65 |
|
|
|
|
$ |
45,406,000 |
| (544,000 exercisable) |
|
|
|
|
|
|
|
|
|
$ |
24,972,000 |
|
|
Options Outstanding |
|
Options Exercisable |
Range of
Exercise Prices
|
|
Number
Outstanding at
December 31,
2007 |
|
Weighted Average
Remaining
Contractual Life
(in years) |
|
Weighted
Average
Exercise
Price |
|
Number
Exercisable at
December 31,
2007 |
|
Weighted Average
Remaining
Contractual Life
(in years) |
|
Weighted
Average
Exercise Price |
| $23.61–$36.99 |
|
184,000 |
|
5.4 |
|
$ |
25.71 |
|
182,000 |
|
5.4 |
|
$ |
25.59 |
| $37.00–$49.99 |
|
597,000 |
|
6.6 |
|
|
43.16 |
|
327,000 |
|
6.3 |
|
|
42.52 |
| $50.00–$102.59 |
|
618,000 |
|
8.7 |
|
|
67.61 |
|
35,000 |
|
6.0 |
|
|
63.46 |
| |
|
1,399,000 |
|
7.4 |
|
$ |
51.65 |
|
544,000 |
|
6.0 |
|
$ |
38.21 |
The
aggregate intrinsic value in the table above represents the total
pretax intrinsic value (the difference between U.S. Cellular's
closing stock price and the exercise price multiplied by the number of
in-the-money options) that was received by the option holders upon
exercise or that would have been received by option holders had all
options been exercised on December 31, 2007. U.S. Cellular
received $10.1 million in cash from the exercise of stock options
during 2007.
A
summary of U.S. Cellular nonvested stock options at
December 31, 2007 and changes during the year then ended is
presented in the table below:
|
|
Number |
|
Weighted Average
Grant Date
Fair Values |
| Nonvested at December 31, 2006 |
|
1,141,000 |
|
$ |
14.06 |
| |
Granted |
|
477,000 |
|
|
16.74 |
| |
Vested |
|
(641,000 |
) |
|
14.45 |
| |
Forfeited |
|
(122,000 |
) |
|
14.82 |
| Nonvested at December 31, 2007 |
|
855,000 |
|
$ |
15.16 |
Restricted
Stock Units–U.S. Cellular grants restricted stock unit awards,
which generally vest after three years, to key employees.
U.S. Cellular
estimates the fair value of restricted stock units based on the closing
market price of U.S. Cellular shares on the date of grant, which
is not adjusted for any dividends foregone during the vesting period
because U.S. Cellular has never paid a dividend and has expressed
its intention to retain all future earnings in the business. The fair
value is then recognized as compensation cost on a straight-line basis
over the requisite service periods of the awards, which is generally
the vesting period. Awards granted under this plan prior to 2005 were
classified as liability awards due to a plan provision which allowed
participants to elect tax withholding in excess of minimum statutory
tax rates. In 2005, this provision was removed from the plan and, thus,
awards after 2005 have been classified as equity awards (except for
awards that may be settled in stock or cash at the option of the
recipient, which are classified as liability awards).
A
summary of U.S. Cellular nonvested restricted stock units at
December 31, 2007 and changes during the year then ended is
presented in the tables that follow:
Liability Classified Awards
|
|
Number |
|
Weighted Average
Grant Date
Fair Values |
| Nonvested at December 31, 2006 |
|
57,000 |
|
$ |
38.65 |
| |
Granted |
|
– |
|
|
– |
| |
Vested |
|
(57,000 |
) |
|
38.65 |
| |
Forfeited |
|
– |
|
|
– |
| Nonvested at December 31, 2007 |
|
– |
|
$ |
– |
| |
|
|
|
|
|
| Equity Classified Awards |
|
Number |
|
Weighted Average
Grant Date
Fair Values |
| Nonvested at December 31, 2006 |
|
288,000 |
|
$ |
51.54 |
| |
Granted |
|
137,000 |
|
|
74.09 |
| |
Vested |
|
(5,000 |
) |
|
73.85 |
| |
Forfeited |
|
(43,000 |
) |
|
55.45 |
| Nonvested at December 31, 2007 |
|
377,000 |
|
$ |
58.92 |
The
total fair values of liability classified restricted stock units that
vested during 2007, 2006 and 2005 were $4,293,000, $7,620,000 and
$2,936,000, respectively. The total fair value of equity classified
restricted stock units that vested during 2007 was $520,000.
Deferred
Compensation Stock Units–Certain U.S. Cellular employees may elect
to defer receipt of all or a portion of their annual bonuses and to
receive a company matching contribution on the amount deferred. All
bonus compensation that is deferred by employees electing to
participate is immediately vested and is deemed to be invested in
U.S. Cellular Common Share stock units. Upon distribution of such
stock units, participants will receive U.S. Cellular Common
Shares. The amount of U.S. Cellular's matching contribution
depends on the portion of the annual bonus that is deferred.
Participants receive a 25% match for amounts deferred up to 50% of
their total annual bonus and a 33% match for amounts that exceed 50% of
their total annual bonus; such matching contributions also are deemed
to be invested in U.S. Cellular Common Share stock units. The
matching contribution stock units vest ratably at a rate of one-third
per year over three years. Upon vesting and distribution of such
matching contribution stock units, participants will receive
U.S. Cellular Common Shares.
U.S. Cellular
estimates the fair value of deferred compensation matching contribution
stock units based on the closing market price of U.S. Cellular
Common Shares on the date of match. The fair value of such matching
contribution stock units is then recognized as compensation cost on a
straight-line basis over the requisite service periods of the awards,
which is generally the vesting period.
Nonvested
deferred compensation units represent matching stock units discussed
above. A summary of U.S. Cellular nonvested deferred compensation
stock units at December 31, 2007 and changes during the year then
ended is presented in the table below:
Deferred Compensation Awards
|
|
Number of
Stock Units |
|
Weighted Average
Grant Date
Fair Values |
| Nonvested at December 31, 2006 |
|
2,400 |
|
$ |
51.39 |
| |
Granted |
|
2,600 |
|
|
70.55 |
| |
Vested |
|
(2,800 |
) |
|
56.36 |
| |
Forfeited |
|
– |
|
|
– |
| Nonvested at December 31, 2007 |
|
2,200 |
|
$ |
67.30 |
Employee
Stock Purchase Plan–Under the 2003 Employee Stock Purchase Plan,
eligible employees of U.S. Cellular and its subsidiaries may
purchase a limited number of U.S. Cellular Common Shares on a
quarterly basis. U.S. Cellular had reserved 97,000 Common Shares
at December 31, 2007 for issuance under this plan. The plan became
effective on April 1, 2003 and will terminate on December 31,
2008. U.S. Cellular employees are also eligible to participate in
the TDS Employee Stock Purchase Plan. The per share cost to each
participant in these plans is 85% of the market value of the
U.S. Cellular Common Shares, TDS Common Shares or TDS Special
Common Shares as of the issuance date. Under SFAS 123(R), the
employee stock purchase plans are considered compensatory plans;
therefore, recognition of compensation cost for stock issued under
these plans is required. Compensation cost is measured as the
difference between the cost of the shares to plan participants and the
fair market value of the shares on the date of issuance. For the years
ended December 31, 2007 and 2006, U.S. Cellular recognized
compensation expense of $124,000 and $39,000 relating to these plans.
Compensation
of Non-Employee Directors–U.S. Cellular issued 700 shares and
1,150 shares in 2007 and 2006, respectively, under its
Non-Employee Director Compensation Plan.
NOTE 23 BUSINESS SEGMENT INFORMATION
TDS
conducts substantially all of its wireless telephone operations through
its 80.8%-owned subsidiary, U.S. Cellular. At December 31,
2007, U.S. Cellular provided cellular telephone service to
customers in 26 states. TDS conducts its wireline telephone
operations through its wholly owned subsidiary,
TDS Telecommunications Corporation ("TDS Telecom").
TDS Telecom provides service through ILEC companies to customers
in 28 states and through CLEC companies to customers in five
states.
U.S. Cellular
and TDS Telecom are billed for all services they receive from TDS,
consisting primarily of information processing and general management
services. Such billings are based on expenses specifically identified
to U.S. Cellular and TDS Telecom and on allocations of common
expenses.
Management
believes the method used to allocate common expenses is reasonable and
that all expenses and costs applicable to U.S. Cellular and
TDS Telecom are reflected in the accompanying business segment
information on a basis that is representative of what they would have
been if U.S. Cellular and TDS Telecom operated on a
stand-alone basis.
Financial
data for TDS' business segments for each of the years ended
December 31, 2007, 2006 and 2005 are as follows:
|
|
|
|
TDS Telecom |
|
|
|
|
|
|
|
Year Ended or at December 31, 2007
|
|
U.S.
Cellular |
|
Non-
Reportable
Segment(1) |
|
Other
Reconciling
Items(2) |
|
|
|
| |
ILEC |
|
CLEC |
|
Total |
|
| (Dollars in thousands) |
|
|
|
| Operating revenues |
|
$ |
3,946,264 |
|
$ |
629,983 |
|
$ |
236,529 |
|
$ |
48,016 |
|
$ |
(31,808 |
) |
$ |
4,828,984 |
|
| Cost of services and products |
|
|
1,357,300 |
|
|
193,761 |
|
|
116,612 |
|
|
36,225 |
|
|
(7,439 |
) |
|
1,696,459 |
|
| Selling, general and administrative expense |
|
|
1,555,639 |
|
|
175,392 |
|
|
82,083 |
|
|
8,145 |
|
|
(23,708 |
) |
|
1,797,551 |
|
| Operating income before depreciation, amortization and accretion, (gain) loss on asset disposals/exchanges(3) |
|
|
1,033,325 |
|
|
260,830 |
|
|
37,834 |
|
|
3,646 |
|
|
(661 |
) |
|
1,334,974 |
|
| Depreciation, amortization and accretion expense |
|
|
582,269 |
|
|
133,440 |
|
|
24,022 |
|
|
2,665 |
|
|
9,823 |
|
|
752,219 |
|
| (Gain) loss on asset disposals/exchanges |
|
|
54,857 |
|
|
– |
|
|
– |
|
|
– |
|
|
– |
|
|
54,857 |
|
| Operating income (loss) |
|
|
396,199 |
|
|
127,390 |
|
|
13,812 |
|
|
981 |
|
|
(10,484 |
) |
|
527,898 |
|
| Significant noncash items: |
|
|
|
|
|
|
|
|
|
|
|
|
|
|
|
|
|
|
|
| |
Equity in earnings of unconsolidated entities |
|
|
90,033 |
|
|
70 |
|
|
– |
|
|
– |
|
|
1,728 |
|
|
91,831 |
|
| |
Fair value adjustment of derivative instruments |
|
|
(5,388 |
) |
|
|
|
|
|
|
|
– |
|
|
(346,182 |
) |
|
(351,570 |
) |
| |
Gain (loss) on investments |
|
|
137,987 |
|
|
– |
|
|
– |
|
|
– |
|
|
295,006 |
|
|
432,993 |
|
| Marketable equity securities |
|
|
16,352 |
|
|
|
|
|
|
|
|
|
|
|
1,901,542 |
|
|
1,917,894 |
|
| Investment in unconsolidated entities |
|
|
157,693 |
|
|
3,677 |
|
|
|
|
|
|
|
|
45,048 |
|
|
206,418 |
|
| Total assets |
|
|
5,611,874 |
|
|
1,679,838 |
|
|
145,864 |
|
|
27,792 |
|
|
2,428,775 |
|
|
9,894,143 |
|
| Capital expenditures |
|
$ |
565,495 |
|
$ |
111,806 |
|
$ |
16,374 |
|
$ |
1,461 |
|
$ |
4,430 |
|
$ |
699,566 |
|
|
| |
|
|
|
TDS Telecom |
|
|
|
|
|
|
|
Year Ended or at December 31, 2005
|
|
U.S.
Cellular |
|
Non-
Reportable
Segment(1) |
|
Other
Reconciling
Items(2) |
|
|
|
| |
ILEC |
|
CLEC |
|
Total |
|
| (Dollars in thousands) |
|
|
|
| Operating revenues |
|
$ |
3,473,155 |
|
$ |
645,525 |
|
$ |
235,804 |
|
$ |
32,448 |
|
$ |
(22,414 |
) |
$ |
4,364,518 |
|
| Cost of services and products |
|
|
1,208,586 |
|
|
191,932 |
|
|
122,527 |
|
|
22,704 |
|
|
(4,208 |
) |
|
1,541,541 |
|
| Selling, general and administrative expense |
|
|
1,399,561 |
|
|
188,229 |
|
|
90,173 |
|
|
6,366 |
|
|
(11,607 |
) |
|
1,672,722 |
|
| Operating income before depreciation, amortization and accretion, (gain) loss on asset disposals/exchanges(3) |
|
|
865,008 |
|
|
265,364 |
|
|
23,104 |
|
|
3,378 |
|
|
(6,599 |
) |
|
1,150,255 |
|
| Depreciation, amortization and accretion expense |
|
|
555,525 |
|
|
135,370 |
|
|
24,242 |
|
|
2,754 |
|
|
– |
|
|
717,891 |
|
| (Gain) loss on asset disposals/exchanges |
|
|
19,587 |
|
|
– |
|
|
– |
|
|
– |
|
|
– |
|
|
19,587 |
|
| Operating income (loss) |
|
|
289,896 |
|
|
129,994 |
|
|
(1,138 |
) |
|
624 |
|
|
(6,599 |
) |
|
412,777 |
|
| Significant noncash items: |
|
|
|
|
|
|
|
|
|
|
|
|
|
|
|
|
|
|
|
| |
Equity in earnings of unconsolidated entities |
|
|
93,119 |
|
|
– |
|
|
– |
|
|
– |
|
|
2,051 |
|
|
95,170 |
|
| |
Fair value adjustment of derivative instruments |
|
|
(63,022 |
) |
|
– |
|
|
– |
|
|
– |
|
|
(236,503 |
) |
|
(299,525 |
) |
| |
Gain on investments |
|
|
70,427 |
|
|
91,419 |
|
|
– |
|
|
– |
|
|
– |
|
|
161,846 |
|
| Marketable equity securities |
|
|
253,912 |
|
|
– |
|
|
– |
|
|
– |
|
|
2,536,718 |
|
|
2,790,630 |
|
| Investment in unconsolidated entities |
|
|
150,325 |
|
|
3,623 |
|
|
– |
|
|
– |
|
|
43,688 |
|
|
197,636 |
|
| Total assets |
|
|
5,680,616 |
|
|
1,699,817 |
|
|
148,186 |
|
|
26,716 |
|
|
3,044,179 |
|
|
10,599,514 |
|
| Capital expenditures |
|
$ |
579,785 |
|
$ |
113,179 |
|
$ |
17,255 |
|
$ |
3,287 |
|
$ |
8,952 |
|
$ |
722,458 |
|
|
| |
|
|
|
TDS Telecom |
|
|
|
|
|
|
|
Year Ended or at December 31, 2005
|
|
U.S.
Cellular |
|
Non-
Reportable
Segment(1) |
|
Other
Reconciling
Items(2) |
|
|
|
| |
ILEC |
|
CLEC |
|
Total |
|
| (Dollars in thousands) |
|
|
|
| Operating revenues |
|
$ |
3,030,765 |
|
$ |
669,724 |
|
$ |
239,341 |
|
$ |
32,080 |
|
$ |
(18,932 |
) |
$ |
3,952,978 |
|
| Cost of services and products |
|
|
1,116,032 |
|
|
177,252 |
|
|
120,924 |
|
|
22,131 |
|
|
(2,616 |
) |
|
1,433,723 |
|
| Selling, general and administrative expense |
|
|
1,217,709 |
|
|
188,361 |
|
|
96,187 |
|
|
5,714 |
|
|
(5,847 |
) |
|
1,502,124 |
|
| Operating income before depreciation, amortization and accretion, (gain) loss on asset disposals/exchanges(3) |
|
|
697,024 |
|
|
304,111 |
|
|
22,230 |
|
|
4,235 |
|
|
(10,469 |
) |
|
1,017,131 |
|
| Depreciation, amortization and accretion expense |
|
|
490,093 |
|
|
135,178 |
|
|
30,438 |
|
|
2,755 |
|
|
– |
|
|
658,464 |
|
| (Gain) loss on asset disposals/exchanges |
|
|
(24,266 |
) |
|
– |
|
|
– |
|
|
– |
|
|
2,235 |
|
|
(22,031 |
) |
| Operating income (loss) |
|
|
231,197 |
|
|
168,933 |
|
|
(8,208 |
) |
|
1,480 |
|
|
(12,704 |
) |
|
380,698 |
|
| Significant noncash items: |
|
|
|
|
|
|
|
|
|
|
|
|
|
|
|
|
|
|
|
| |
Equity in earnings of unconsolidated entities |
|
|
66,719 |
|
|
408 |
|
|
– |
|
|
– |
|
|
912 |
|
|
68,039 |
|
| |
Fair value adjustment of derivative instruments |
|
|
44,977 |
|
|
– |
|
|
– |
|
|
– |
|
|
688,751 |
|
|
733,728 |
|
| |
Gain on investments |
|
|
(6,203 |
) |
|
– |
|
|
– |
|
|
– |
|
|
(51 |
) |
|
(6,254 |
) |
| Marketable equity securities |
|
|
225,387 |
|
|
– |
|
|
– |
|
|
– |
|
|
2,306,303 |
|
|
2,531,690 |
|
| Investment in unconsolidated entities |
|
|
172,093 |
|
|
3,623 |
|
|
– |
|
|
– |
|
|
41,464 |
|
|
217,180 |
|
| Total assets |
|
|
5,416,233 |
|
|
1,703,443 |
|
|
161,392 |
|
|
26,178 |
|
|
2,897,536 |
|
|
10,204,782 |
|
| Capital expenditures |
|
$ |
576,525 |
|
$ |
97,493 |
|
$ |
27,117 |
|
$ |
3,950 |
|
$ |
5,422 |
|
$ |
710,507 |
|
Year Ended December 31,
|
|
2007 |
|
2006 |
|
2005 |
| (Dollars in thousands) |
|
|
| Total operating income from reportable and other segments |
|
$ |
527,898 |
|
$ |
412,777 |
|
$ |
380,698 |
| Investment and other income and expense |
|
|
157,552 |
|
|
(89,439 |
) |
|
726,437 |
| Income from continuing operations before income taxes and minority interest |
|
$ |
685,450 |
|
$ |
323,338 |
|
$ |
1,107,135 |
NOTE 24 DISCONTINUED OPERATIONS
TDS
is party to an indemnity agreement with T-Mobile (f/k/a VoiceStream
Wireless) regarding certain contingent liabilities at Aerial
Communications for the period prior to Aerial's merger into VoiceStream
Wireless Corporation in 2000. Aerial Communications was a former
80%-owned subsidiary of TDS.
In
2006 and 2005, TDS paid $1.9 million and $7.1 million,
respectively, which included expenses related to the settlement of
items related to this indemnity agreement. There was no related
activity in 2007.
In
2005, TDS recorded a gain of $1.0 million ($1.5 million, net
of a $0.5 million income tax expense), or $0.01 per diluted share,
for discontinued operations relating to a reduction in this indemnity
accrual due to the favorable outcomes of state tax audits which reduced
the potential indemnity obligation. This amount was recorded as
Discontinued operations in the Consolidated Statements of Operations.
NOTE 25 SUPPLEMENTAL CASH FLOW DISCLOSURES
Following
are supplemental cash flow disclosures regarding interest paid and
income taxes paid (refunds received) and certain noncash transactions.
Year Ended December 31,
|
|
2007 |
|
2006 |
|
2005 |
| (Dollars in thousands) |
|
|
| Interest paid |
|
$ |
196,696 |
|
$ |
215,947 |
|
$ |
194,632 |
| Income taxes paid |
|
|
500,899 |
|
|
331,268 |
|
|
151,076 |
| Common shares issued for conversion of preferred shares |
|
|
– |
|
|
3,000 |
|
|
– |
| Net assets acquired in exchange of business assets |
|
$ |
– |
|
$ |
– |
|
$ |
106,757 |
TDS
withheld 38,805 Common Shares and 59,432 Special Common Shares with an
aggregate value of $6.1 million in 2007, 3,960 Common Shares and
883 Special Common Shares with an aggregate value of $0.3 million
in 2006, and 977 Common Shares and 1,401 Special Common Shares with an
aggregate value of $0.1 million in 2005, from employees who
exercised stock options or who received distribution of vested
restricted stock awards. Such shares were withheld to cover the
exercise price of stock options, if applicable, and required tax
withholdings.
U.S. Cellular
withheld 716,446, 54,537 and 19,147 Common Shares with an aggregate
value of $60.0 million, $3.2 million and $0.9 million in
2007, 2006 and 2005, respectively, from employees who exercised stock
options or who received a distribution of vested restricted stock
awards. Such shares were withheld to cover the exercise price of stock
options, if applicable, and required tax withholdings.
NOTE 26 NOTES RECEIVABLE
Included
in notes receivable at December 31, 2007 is a loan of
$55.1 million to Airadigm Communications, Inc. ("Airadigm"),
a wireless communications provider, related to the funding of
Airadigm's operations. The value of the loan was directly related to
the values of certain assets and contractual rights of Airadigm. The
loan had been determined by management to be impaired in 2001 due to
Airadigm's business strategies and other events that caused management
to doubt the probable collection of the amounts due in accordance with
the contractual terms of the note. A full valuation allowance of
$55.1 million was recorded in 2001 against the loan.
NOTE 27 SUBSEQUENT EVENTS
The
variable prepaid forward contracts ("forward contracts") related to
30 million of TDS' Deutsche Telekom ordinary shares matured in
January and February 2008. TDS elected to deliver a substantial
majority of the Deutsche Telekom ordinary shares in settlement of the
forward contracts, and to dispose of the remaining Deutsche Telekom
ordinary shares related to such contracts. TDS realized cash proceeds
of $48.6 upon sale of the remaining shares.
From
time to time, the FCC conducts auctions through which additional
spectrum is made available for the provision of wireless services. An
FCC auction of spectrum in the 700 megahertz band, designated by
the FCC as Auction 73, began on January 24, 2008.
U.S. Cellular is participating in Auction 73 indirectly
through its interest in King Street Wireless, L.P. ("King Street
Wireless"), which is participating in Auction 73. A subsidiary of
U.S. Cellular is a limited partner in King Street Wireless. King
Street Wireless intends to qualify as a "designated entity," and
thereby be eligible for bid credits with respect to spectrum purchased
in Auction 73.
In
January 2008, U.S. Cellular made capital contributions and
advances to King Street Wireless and/or its general partner of
$97 million to allow King Street Wireless to participate in
Auction 73. King Street Wireless is in the process of developing
its long-term business and financing plans. Pending finalization of
King Street Wireless' permanent financing plans, and upon request by
King Street Wireless, U.S. Cellular may agree to make additional
capital contributions and/or advances to King Street Wireless and/or
its general partner. U.S. Cellular will consolidate King Street
Wireless and King Street Wireless, Inc., the general partner of
King Street Wireless, for financial reporting purposes, pursuant to the
guidelines of FIN 46(R), as U.S. Cellular anticipates
benefiting from or absorbing a majority of King Street Wireless'
expected gains or losses.
FCC
anti-collusion rules place certain restrictions on business
communications and disclosures by participants in an FCC auction. As
noted above, Auction 73 began on January 24, 2008. If certain
reserve prices are not met, the FCC will follow Auction 73 with a
contingent auction, referred to as Auction 76. For purposes of
applying its anti-collusion rules, the FCC has determined that both
auctions will be treated as a single auction, which means that, in the
event that the contingent auction is needed, the anti-collusion rules
would last from the application deadline for Auction 73, which was
December 3, 2007, until the deadline by which winning bidders in
Auction 76 must make the required down payment. The FCC
anti-collusion rules place certain restrictions on business
communications with other companies and on public disclosures relating
to U.S. Cellular's participation in an FCC auction. For instance,
these anti-collusion rules may restrict the normal conduct of
U.S. Cellular's business and/or disclosures by U.S. Cellular
relating to the auctions, which could last 3 to 6 months or more.
As of the time of filing this report, Auction 73 was still in
progress.
There
is no assurance that King Street Wireless will be successful in the
auctions or that acceptable spectrum will be available at acceptable
prices in the auction. If King Street Wireless is successful in
Auction 73, it may be required to raise additional capital through
a combination of additional debt and/or equity financing. In such case,
U.S. Cellular may make additional capital contributions to King
Street Wireless and/or its general partner to provide additional
funding of any licenses granted to King Street Wireless pursuant to
Auction 73. The possible amount of such additional capital
contributions is not known at this time but could be substantial. In
such case, U.S. Cellular may finance such amounts from cash on
hand, from borrowings under its revolving credit agreement and/or
long-term debt. There is no assurance that U.S. Cellular will be
able to obtain such additional financing on commercially reasonable
terms or at all.
NOTE 28 CERTAIN RELATIONSHIPS AND RELATED TRANSACTIONS
The
following persons are partners of Sidley Austin LLP, the principal
law firm of TDS and its subsidiaries: Walter C.D. Carlson, a
trustee and beneficiary of a voting trust that controls TDS, the
non-executive Chairman of the Board and member of the board of
directors of TDS and a director of U.S. Cellular, a subsidiary of
TDS; William S. DeCarlo, the General Counsel of TDS and an Assistant
Secretary of TDS and certain subsidiaries of TDS; and Stephen P.
Fitzell, the General Counsel of U.S. Cellular and
TDS Telecommunications Corporation and an Assistant Secretary of
certain subsidiaries of TDS. Walter C.D. Carlson does not provide legal
services to TDS or its subsidiaries. TDS, U.S. Cellular and their
subsidiaries incurred legal costs from Sidley Austin LLP of
$11.2 million in 2007, $12.0 million in 2006 and
$7.8 million in 2005.
The
Audit Committee of the Board of Directors is responsible for the review
and oversight of all related party transactions, as such term is
defined by the rules of the American Stock Exchange.
Telephone and Data Systems, Inc. and Subsidiaries - Reports of Management
Management's Responsibility for Financial Statements
Management
of Telephone and Data Systems, Inc. has the responsibility for
preparing the accompanying consolidated financial statements and for
their integrity and objectivity. The statements were prepared in
accordance with accounting principles generally accepted in the United
States of America and, in management's opinion, are fairly presented.
The financial statements include amounts that are based on management's
best estimates and judgments. Management also prepared the other
information in the annual report and is responsible for its accuracy
and consistency with the financial statements.
PricewaterhouseCoopers LLP,
an independent registered public accounting firm, has audited these
consolidated financial statements in accordance with the standards of
the Public Company Accounting Oversight Board (United States) and has
expressed herein its unqualified opinion on these financial statements.
/s/ LeRoy T. Carlson, Jr.
LeRoy T. Carlson, Jr.
President and
Chief Executive Officer
(Principal Executive Officer) |
|
/s/ Kenneth R. Meyers
Kenneth R. Meyers
Executive Vice President and
Chief Financial Officer
(Principal Financial Officer) |
|
/s/ Douglas D. Shuma
Douglas D. Shuma
Senior Vice President and
Controller
(Principal Accounting Officer) |
Management's Report on Internal Control Over Financial Reporting
Management
is responsible for establishing and maintaining adequate internal
control over financial reporting, as such term is defined in
Rules 13a-15(f) and 15d-15(f) under the Exchange Act. TDS'
internal control over financial reporting is a process designed to
provide reasonable assurance regarding the reliability of financial
reporting and the preparation of financial statements for external
purposes in accordance with accounting principles generally accepted in
the United States of America ("GAAP"). TDS' internal control over
financial reporting includes those policies and procedures that
(i) pertain to the maintenance of records that, in reasonable
detail, accurately and fairly reflect the transactions and dispositions
of the assets of the issuer; (ii) provide reasonable assurance
that transactions are recorded as necessary to permit preparation of
financial statements in accordance with GAAP, and that receipts and
expenditures of the issuer are being made only in accordance with
authorizations of management and, where required, the board of
directors of the issuer; and (iii) provide reasonable assurance
regarding prevention or timely detection of unauthorized acquisition,
use, or disposition of the issuer's assets that could have a material
effect on the interim or annual consolidated financial statements.
Because
of its inherent limitations, internal control over financial reporting
may not prevent or detect misstatements. Also, projections of any
evaluation of effectiveness to future periods are subject to the risk
that controls may become inadequate because of changes in conditions,
or that the degree of compliance with the policies or procedures may
deteriorate.
Under
the supervision and with the participation of TDS' management,
including its Chief Executive Officer and Chief Financial Officer, TDS
conducted an evaluation of the effectiveness of its internal control
over financial reporting as of December 31, 2007, based on the
criteria established in Internal Control–Integrated
Framework issued by the Committee of Sponsoring Organizations of the Treadway Commission (COSO).
A
material weakness is a deficiency, or a combination of deficiencies, in
internal control over financial reporting such that there is a
reasonable possibility that a material misstatement of the company's
annual or interim financial statements will not be prevented or
detected on a timely basis. Management identified the following
material weakness in internal control over financial reporting as of
December 31, 2007:
TDS
did not maintain effective controls over the completeness, accuracy,
presentation and disclosure of its accounting for income taxes.
Specifically, TDS did not have effective controls designed and in place
to monitor the difference between the income tax basis and the
financial reporting basis of assets and liabilities and reconcile the
resulting basis difference to its deferred income tax asset and
liability balances. This control deficiency affected deferred income
tax asset and liability accounts and income taxes payable. This control
deficiency resulted in the restatement of TDS' annual consolidated
financial statements for 2005, 2004, 2003 and 2002, the interim
consolidated financial statements for all quarters in 2005, 2004 and
2003, the interim consolidated financial statements for the first and
second quarters of 2006, as well as adjustments, including audit
adjustments, to the 2006 third quarter interim consolidated financial
statements and the 2006 and 2007 annual consolidated financial
statements. Additionally, this control deficiency could result in a
misstatement of the aforementioned accounts that would result in a
material misstatement to TDS' interim or annual consolidated financial
statements that would not be prevented or detected. Accordingly, our
management has determined that this control deficiency constitutes a
material weakness.
As
a result of the material weakness identified above, management has
concluded that TDS did not maintain effective internal control over
financial reporting as of December 31, 2007 based on criteria
established in Internal Control–Integrated Framework issued by the COSO.
The
effectiveness of TDS' internal control over financial reporting as of
December 31, 2007 has been audited by
PricewaterhouseCoopers LLP, an independent registered public
accounting firm, as stated in the firm's report included herein.
/s/ LeRoy T. Carlson, Jr.
LeRoy T. Carlson, Jr.
President and
Chief Executive Officer
(Principal Executive Officer) |
|
/s/ Kenneth R. Meyers
Kenneth R. Meyers
Executive Vice President and
Chief Financial Officer
(Principal Financial Officer) |
|
/s/ Douglas D. Shuma
Douglas D. Shuma
Senior Vice President and
Controller
(Principal Accounting Officer) |
Telephone and Data Systems, Inc. and Subsidiaries - Report of Independent Registered Public Accounting Firm
To
the Board of Directors and Stockholders of
Telephone and Data Systems, Inc.
In
our opinion, based on our audits and the report of other auditors, the
accompanying consolidated balance sheets and the related consolidated
statements of operations, common stockholders' equity, and cash flows
present fairly, in all material respects, the financial position of
Telephone and Data Systems, Inc. and its subsidiaries (the
Company) at December 31, 2007 and 2006, and the results of their
operations and their cash flows for each of the three years in the
period ended December 31, 2007 in conformity with accounting
principles generally accepted in the United States of America. Also in
our opinion, the Company did not maintain, in all material respects,
effective internal control over financial reporting as of
December 31, 2007, based on criteria established in Internal Control–Integrated Framework
issued by the Committee of Sponsoring Organizations of the Treadway
Commission (COSO) because a material weakness in internal control over
financial reporting related to the completeness, accuracy, presentation
and disclosure of its accounting for income taxes existed as of that
date. A material weakness is a deficiency, or a combination of
deficiencies, in internal control over financial reporting, such that
there is a reasonable possibility that a material misstatement of the
annual or interim financial statements will not be prevented or
detected on a timely basis. The material weakness referred to above is
described in the accompanying Management's Report on Internal Control
Over Financial Reporting. We considered this material weakness in
determining the nature, timing, and extent of audit tests applied in
our audit of the 2007 consolidated financial statements, and our
opinion regarding the effectiveness of the Company's internal control
over financial reporting does not affect our opinion on those
consolidated financial statements. The Company's management is
responsible for these financial statements, for maintaining effective
internal control over financial reporting and for its assessment of the
effectiveness of internal control over financial reporting, included in
management's report referred to above. Our responsibility is to express
opinions on these financial statements and on the Company's internal
control over financial reporting based on our integrated audits. We did
not audit the financial statements of Los Angeles SMSA Limited
Partnership, a 5.5% owned entity accounted for by the equity method of
accounting. The consolidated financial statements of Telephone and Data
Systems, Inc. reflect an investment in this partnership of
$117,200,000 and $112,000,000 as of December 31, 2007 and 2006,
respectively, and equity earnings of $71,200,000, $62,300,000 and
$52,200,000, respectively for each of the three years in the period
ended December 31, 2007. The financial statements of Los Angeles
SMSA Limited Partnership were audited by other auditors whose report
thereon has been furnished to us, and our opinion on the financial
statements expressed herein, insofar as it relates to the amounts
included for Los Angeles SMSA Limited Partnership, is based solely on
the report of the other auditors. We conducted our audits in accordance
with the standards of the Public Company Accounting Oversight Board
(United States). Those standards require that we plan and perform the
audits to obtain reasonable assurance about whether the financial
statements are free of material misstatement and whether effective
internal control over financial reporting was maintained in all
material respects. Our audits of the financial statements included
examining, on a test basis, evidence supporting the amounts and
disclosures in the financial statements, assessing the accounting
principles used and significant estimates made by management, and
evaluating the overall financial statement presentation. Our audit of
internal control over financial reporting included obtaining an
understanding of internal control over financial reporting, assessing
the risk that a material weakness exists, and testing and evaluating
the design and operating effectiveness of internal control based on the
assessed risk. Our audits also included performing such other
procedures as we considered necessary in the circumstances. We believe
that our audits and the report of other auditors provide a reasonable
basis for our opinions.
As
described in Notes 1, 17 and 22 to the consolidated financial
statements, the Company changed the manner in which it accounts for
share-based compensation and pension and other post-retirement benefits
in 2006. Additionally, as discussed in Notes 1 and 4, the Company
changed the manner in which it accounts for uncertain tax positions as
of January 1, 2007.
A
company's internal control over financial reporting is a process
designed to provide reasonable assurance regarding the reliability of
financial reporting and the preparation of financial statements for
external purposes in accordance with generally accepted accounting
principles. A company's internal control over financial reporting
includes those policies and procedures that (i) pertain to the
maintenance of records that, in reasonable detail, accurately and
fairly reflect the transactions and dispositions of the assets of the
company; (ii) provide reasonable assurance that transactions are
recorded as necessary to permit preparation of financial statements in
accordance with generally accepted accounting principles, and that
receipts and expenditures of the company are being made only in
accordance with authorizations of management and directors of the
company; and (iii) provide reasonable assurance regarding
prevention or timely detection of unauthorized acquisition, use, or
disposition of the company's assets that could have a material effect
on the financial statements.
Because
of its inherent limitations, internal control over financial reporting
may not prevent or detect misstatements. Also, projections of any
evaluation of effectiveness to future periods are subject to the risk
that controls may become inadequate because of changes in conditions,
or that the degree of compliance with the policies or procedures may
deteriorate.
/s/
PricewaterhouseCoopers LLP
Chicago, Illinois
February 29, 2008
Telephone and Data Systems, Inc. and Subsidiaries - Selected Consolidated Financial Data
Year Ended or at December 31,
|
|
2007 |
|
2006 |
|
2005 |
|
2004 |
|
2003 |
|
| (Dollars in thousands, except per share amounts) |
|
|
|
| Operating Data |
|
|
|
|
|
|
|
|
|
|
|
|
|
|
|
|
| Operating revenues |
|
$ |
4,828,984 |
|
$ |
4,364,518 |
|
$ |
3,952,978 |
|
$ |
3,702,137 |
|
$ |
3,455,230 |
|
| Operating income |
|
|
527,898 |
|
|
412,777 |
|
|
380,698 |
|
|
201,253 |
|
|
(93,444 |
) |
| Fair value adjustment of derivative instruments |
|
|
(351,570 |
) |
|
(299,525 |
) |
|
733,728 |
|
|
(518,959 |
) |
|
(297,073 |
) |
| Gain (loss) on investments |
|
|
432,993 |
|
|
161,846 |
|
|
(6,254 |
) |
|
38,209 |
|
|
(10,200 |
) |
| Income (loss) from continuing operations |
|
|
343,285 |
|
|
161,759 |
|
|
646,743 |
|
|
(259,297 |
) |
|
(409,860 |
) |
| Discontinued operations, net of tax |
|
|
– |
|
|
– |
|
|
997 |
|
|
6,362 |
|
|
(1,609 |
) |
| Extraordinary item, net of tax |
|
|
42,827 |
|
|
|
|
|
|
|
|
|
|
|
|
|
| Cumulative effect of accounting change |
|
|
– |
|
|
– |
|
|
– |
|
|
– |
|
|
(11,789 |
) |
| Net income (loss) available to common |
|
$ |
386,060 |
|
$ |
161,594 |
|
$ |
647,538 |
|
$ |
(253,138 |
) |
$ |
(423,675 |
) |
Basic weighted average shares outstanding (000s) |
|
|
117,624 |
|
|
115,904 |
|
|
115,296 |
|
|
114,592 |
|
|
115,442 |
|
| Basic earnings (loss) per share from: |
|
|
|
|
|
|
|
|
|
|
|
|
|
|
|
|
| |
Continuing operations(d) |
|
$ |
2.92 |
|
$ |
1.39 |
|
$ |
5.61 |
|
$ |
(2.26 |
) |
$ |
(3.56 |
) |
| |
Discontinued operations(d) |
|
|
– |
|
|
– |
|
|
0.01 |
|
|
0.05 |
|
|
(0.01 |
) |
| |
Extraordinary item(d) |
|
|
0.36 |
|
|
|
|
|
|
|
|
|
|
|
|
|
| |
Cumulative effect of accounting change(d) |
|
|
– |
|
|
– |
|
|
– |
|
|
– |
|
|
(0.10 |
) |
| |
Income (loss) available to common(d) |
|
$ |
3.28 |
|
$ |
1.39 |
|
$ |
5.62 |
|
$ |
(2.21 |
) |
$ |
(3.67 |
) |
Diluted weighted average shares outstanding (000s) |
|
|
119,126 |
|
|
116,844 |
|
|
116,081 |
|
|
114,592 |
|
|
115,442 |
|
| Diluted earnings (loss) per share from: |
|
|
|
|
|
|
|
|
|
|
|
|
|
|
|
|
| |
Continuing operations(d) |
|
$ |
2.86 |
|
$ |
1.37 |
|
$ |
5.56 |
|
$ |
(2.26 |
) |
$ |
(3.56 |
) |
| |
Discontinued operations(d) |
|
|
– |
|
|
– |
|
|
0.01 |
|
|
0.05 |
|
|
(0.01 |
) |
| |
Extraordinary item(d) |
|
|
0.36 |
|
|
|
|
|
|
|
|
|
|
|
|
|
| |
Cumulative effect of accounting change(d) |
|
|
– |
|
|
– |
|
|
– |
|
|
– |
|
|
(0.10 |
) |
| |
Income (loss) available to common(d) |
|
$ |
3.22 |
|
$ |
1.37 |
|
$ |
5.57 |
|
$ |
(2.21 |
) |
$ |
(3.67 |
) |
Dividends per Common, Special Common and |
|
|
|
|
|
|
|
|
|
|
|
|
|
|
|
|
| |
Series A Common Share(d) |
|
$ |
0.39 |
|
$ |
0.37 |
|
$ |
0.35 |
|
$ |
0.33 |
|
$ |
0.31 |
|
Pro forma(a) |
|
|
|
|
|
|
|
|
|
|
|
|
|
|
|
|
| |
Net income (loss) |
|
|
N/A |
|
|
N/A |
|
|
N/A |
|
|
N/A |
|
$ |
(411,469 |
) |
| |
Basic earnings (loss) per share |
|
|
N/A |
|
|
N/A |
|
|
N/A |
|
|
N/A |
|
|
(3.56 |
) |
| |
Diluted earnings (loss) per share |
|
|
N/A |
|
|
N/A |
|
|
N/A |
|
|
N/A |
|
$ |
(3.56 |
) |
Balance Sheet Data |
|
|
|
|
|
|
|
|
|
|
|
|
|
|
|
|
| Cash and cash equivalents |
|
$ |
1,174,446 |
|
$ |
1,013,325 |
|
$ |
1,095,791 |
|
$ |
1,171,105 |
|
$ |
940,578 |
|
| Marketable equity securities |
|
|
1,917,894 |
|
|
2,790,630 |
|
|
2,531,690 |
|
|
3,398,804 |
|
|
2,772,410 |
|
| Property, plant and equipment, net |
|
|
3,525,102 |
|
|
3,581,386 |
|
|
3,529,760 |
|
|
3,425,903 |
|
|
3,404,815 |
|
| Total assets |
|
|
9,894,143 |
|
|
10,599,514 |
|
|
10,204,782 |
|
|
10,821,899 |
|
|
10,036,503 |
|
| Notes payable |
|
|
– |
|
|
35,000 |
|
|
135,000 |
|
|
30,000 |
|
|
– |
|
| Long-term debt, excluding current portion |
|
|
1,632,226 |
|
|
1,633,308 |
|
|
1,633,519 |
|
|
1,974,599 |
|
|
1,994,913 |
|
| Prepaid forward contracts, excluding current portion |
|
|
– |
|
|
987,301 |
|
|
1,707,282 |
|
|
1,689,644 |
|
|
1,672,762 |
|
| Common stockholders' equity |
|
|
3,926,338 |
|
|
3,570,420 |
|
|
3,217,195 |
|
|
3,076,043 |
|
|
2,953,223 |
|
| Capital expenditures |
|
$ |
699,566 |
|
$ |
722,458 |
|
$ |
710,507 |
|
$ |
786,623 |
|
$ |
776,037 |
|
| Current ratio(b) |
|
|
1.4 |
|
|
1.4 |
|
|
1.7 |
|
|
2.5 |
|
|
2.1 |
|
| Return on average equity(c) |
|
|
9.2 |
% |
|
4.8 |
% |
|
20.6 |
% |
|
(8.6 |
)% |
|
(13.3 |
)% |
Telephone and Data Systems, Inc. and Subsidiaries - Five-Year Statistical Summary
At or Year Ended December 31,
|
|
2007 |
|
2006 |
|
2005 |
|
2004 |
|
2003 |
|
| (Dollars in thousands, except per unit amounts) |
|
|
|
| Wireless Operations |
|
|
|
|
|
|
|
|
|
|
|
|
|
|
|
|
| Total number of consolidated markets(a) |
|
|
218 |
|
|
201 |
|
|
189 |
|
|
175 |
|
|
182 |
|
| Customers |
|
|
6,122,000 |
|
|
5,815,000 |
|
|
5,482,000 |
|
|
4,945,000 |
|
|
4,409,000 |
|
| Total population(b) |
|
|
|
|
|
|
|
|
|
|
|
|
|
|
|
|
| |
Consolidated markets |
|
|
82,371,000 |
|
|
55,543,000 |
|
|
45,244,000 |
|
|
44,391,000 |
|
|
46,267,000 |
|
| |
Consolidated operating markets |
|
|
44,955,000 |
|
|
44,043,000 |
|
|
43,362,000 |
|
|
39,893,000 |
|
|
39,549,000 |
|
| Market penetration(c) |
|
|
|
|
|
|
|
|
|
|
|
|
|
|
|
|
| |
Consolidated markets |
|
|
7.4 |
% |
|
10.5 |
% |
|
12.1 |
% |
|
11.1 |
% |
|
9.5 |
% |
| |
Consolidated operating markets |
|
|
13.6 |
% |
|
13.2 |
% |
|
12.6 |
% |
|
12.4 |
% |
|
11.1 |
% |
| Net customer additions |
|
|
301,000 |
|
|
310,000 |
|
|
477,000 |
|
|
627,000 |
|
|
447,000 |
|
| Postpay churn rate per month(d) |
|
|
|
|
|
|
|
|
|
|
|
|
|
|
|
|
| |
Retail |
|
|
1.4 |
% |
|
1.6 |
% |
|
1.6 |
% |
|
1.5 |
% |
|
1.6 |
% |
| |
Total |
|
|
1.7 |
% |
|
2.1 |
% |
|
2.1 |
% |
|
N/A |
|
|
N/A |
|
| Average monthly service revenue per customer(e) |
|
$ |
51.13 |
|
$ |
47.23 |
|
$ |
45.24 |
|
$ |
46.58 |
|
$ |
47.31 |
|
| Average monthly local minutes of use per customer |
|
|
859 |
|
|
704 |
|
|
625 |
|
|
539 |
|
|
422 |
|
Wireline Operations
ILEC |
|
|
|
|
|
|
|
|
|
|
|
|
|
|
|
|
| |
Equivalent access lines served(f) |
|
|
762,700 |
|
|
757,300 |
|
|
735,300 |
|
|
730,400 |
|
|
722,200 |
|
| |
Telephone companies |
|
|
111 |
|
|
111 |
|
|
111 |
|
|
111 |
|
|
111 |
|
| |
Capital expenditures |
|
$ |
111,806 |
|
$ |
113,179 |
|
$ |
97,493 |
|
$ |
103,069 |
|
$ |
111,924 |
|
| CLEC |
|
|
|
|
|
|
|
|
|
|
|
|
|
|
|
|
| |
Equivalent access lines served(f) |
|
|
435,000 |
|
|
456,200 |
|
|
448,600 |
|
|
426,800 |
|
|
364,800 |
|
| |
Capital expenditures |
|
$ |
16,374 |
|
$ |
17,255 |
|
$ |
27,117 |
|
$ |
35,178 |
|
$ |
27,294 |
|
Financial Position |
|
|
|
|
|
|
|
|
|
|
|
|
|
|
|
|
| Common, Special Common and Series A Common Shares outstanding (000s) |
|
|
117,823 |
|
|
116,592 |
|
|
115,555 |
|
|
114,872 |
|
|
114,068 |
|
| Price/earnings ratio(g) |
|
|
42.03 |
|
|
75.86 |
|
|
12.71 |
|
|
N/M |
|
|
N/M |
|
| Common equity per share(h) |
|
|
31.17 |
|
|
28.35 |
|
|
25.58 |
|
|
24.49 |
|
|
23.54 |
|
| Year-end stock price(h) |
|
|
|
|
|
|
|
|
|
|
|
|
|
|
|
|
| Common Shares |
|
$ |
62.60 |
|
$ |
54.33 |
|
$ |
36.03 |
|
$ |
76.95 |
|
$ |
62.55 |
|
| Special Common Shares |
|
|
57.60 |
|
|
49.60 |
|
|
34.61 |
|
|
– |
|
|
– |
|
| |
Combined |
|
$ |
120.20 |
|
$ |
103.93 |
|
$ |
70.64 |
|
$ |
76.95 |
|
$ |
62.55 |
|
| Dividends per share(h) |
|
$ |
0.39 |
|
$ |
0.37 |
|
$ |
0.35 |
|
$ |
0.33 |
|
$ |
0.31 |
|
Telephone and Data Systems, Inc. and Subsidiaries - Consolidated Quarterly Information (Unaudited)
|
|
Quarter Ended |
|
|
|
March 31 |
|
June 30 |
|
September 30 |
|
December 31 |
|
(Dollars in thousands, except per share amounts)
|
|
|
|
| 2007 |
|
|
|
|
|
|
|
|
|
|
|
|
|
| Operating revenues |
|
$ |
1,156,557 |
|
$ |
1,192,834 |
|
$ |
1,236,885 |
|
$ |
1,242,708 |
|
| Operating income(1)(2) |
|
|
142,797 |
|
|
153,955 |
|
|
134,489 |
|
|
96,657 |
|
| Fair value adjustment of derivative instruments(3) |
|
|
255,870 |
|
|
(358,119 |
) |
|
(54,824 |
) |
|
(194,497 |
) |
| Gain on investments(4) |
|
|
– |
|
|
137,920 |
|
|
248,860 |
|
|
46,213 |
|
| Income (loss) from continuing operations(5) |
|
|
219,325 |
|
|
(8,627 |
) |
|
188,910 |
|
|
(56,323 |
) |
| Extraordinary item, net of tax |
|
|
– |
|
|
– |
|
|
42,827 |
|
|
– |
|
| Net income (loss) |
|
$ |
219,325 |
|
$ |
(8,627 |
) |
$ |
231,737 |
|
$ |
(56,323 |
) |
| Basic weighted average shares outstanding (000s) |
|
|
116,837 |
|
|
117,031 |
|
|
118,705 |
|
|
117,914 |
|
| Basic earnings (loss) per share from continuing operations |
|
$ |
1.88 |
|
$ |
(0.07 |
) |
$ |
1.59 |
|
$ |
(0.48 |
) |
| Extraordinary item, net of tax |
|
|
– |
|
|
– |
|
|
0.36 |
|
|
– |
|
| Basic earnings (loss) per share–net income |
|
$ |
1.88 |
|
$ |
(0.07 |
) |
$ |
1.95 |
|
$ |
(0.48 |
) |
Diluted weighted average shares outstanding (000s) |
|
|
118,383 |
|
|
117,031 |
|
|
119,950 |
|
|
117,914 |
|
| Diluted earnings (loss) per share from continuing operations |
|
$ |
1.85 |
|
$ |
(0.08 |
) |
$ |
1.57 |
|
$ |
(0.48 |
) |
| Extraordinary item, net of tax |
|
|
– |
|
|
– |
|
|
0.36 |
|
|
– |
|
| Diluted earnings (loss) per share–net income |
|
$ |
1.85 |
|
$ |
(0.08 |
) |
$ |
1.93 |
|
$ |
(0.48 |
) |
Stock price |
|
|
|
|
|
|
|
|
|
|
|
|
|
| |
TDS Common Shares |
|
|
|
|
|
|
|
|
|
|
|
|
|
| |
|
High |
|
$ |
59.94 |
|
$ |
65.75 |
|
$ |
73.67 |
|
$ |
72.31 |
|
| |
|
Low |
|
|
53.02 |
|
|
55.18 |
|
|
53.10 |
|
|
58.57 |
|
| |
|
Quarter-end close |
|
|
59.62 |
|
|
62.57 |
|
|
66.75 |
|
|
62.60 |
|
| |
TDS Special Common Shares |
|
|
|
|
|
|
|
|
|
|
|
|
|
| |
|
High |
|
|
56.25 |
|
|
61.40 |
|
|
68.65 |
|
|
67.00 |
|
| |
|
Low |
|
|
48.28 |
|
|
51.39 |
|
|
49.17 |
|
|
54.36 |
|
| |
|
Quarter-end close |
|
|
55.90 |
|
|
57.55 |
|
|
62.00 |
|
|
57.60 |
|
| Dividends paid |
|
$ |
0.0975 |
|
$ |
0.0975 |
|
$ |
0.0975 |
|
$ |
0.0975 |
|
|
|
|
Quarter Ended |
|
|
|
March 31 |
|
June 30 |
|
September 30 |
|
December 31 |
|
| (Dollars in thousands, except per share amounts) |
|
|
|
| 2006 |
|
|
|
|
|
|
|
|
|
|
|
|
|
| Operating revenues |
|
$ |
1,059,077 |
|
$ |
1,068,687 |
|
$ |
1,112,070 |
|
$ |
1,124,684 |
|
| Operating income |
|
|
107,184 |
|
|
107,309 |
|
|
110,375 |
|
|
87,909 |
|
| Fair value adjustment of derivative instruments |
|
|
30 |
|
|
(11,768 |
) |
|
34,619 |
|
|
(322,406 |
) |
| Gain on investments(6) |
|
|
– |
|
|
91,418 |
|
|
– |
|
|
70,428 |
|
| Income (loss) from continuing operations |
|
|
35,997 |
|
|
166,759 |
|
|
75,239 |
|
|
(116,236 |
) |
Net income (loss) |
|
$ |
35,997 |
|
$ |
166,759 |
|
$ |
75,239 |
|
$ |
(116,236 |
) |
Basic weighted average shares outstanding (000s) |
|
|
115,741 |
|
|
115,768 |
|
|
115,768 |
|
|
116,335 |
|
| Basic earnings (loss) per share from continuing operations |
|
$ |
0.31 |
|
$ |
1.44 |
|
$ |
0.65 |
|
$ |
(1.00 |
) |
| Discontinued operations |
|
|
– |
|
|
– |
|
|
– |
|
|
– |
|
| Basic earnings (loss) per share–net income |
|
$ |
0.31 |
|
$ |
1.44 |
|
$ |
0.65 |
|
$ |
(1.00 |
) |
Diluted weighted average shares outstanding (000s) |
|
|
116,327 |
|
|
116,640 |
|
|
116,862 |
|
|
116,335 |
|
| Diluted earnings (loss) per share from continuing operations |
|
$ |
0.31 |
|
$ |
1.43 |
|
$ |
0.64 |
|
$ |
(1.00 |
) |
| Discontinued operations |
|
|
– |
|
|
– |
|
|
– |
|
|
– |
|
| Diluted earnings (loss) per share–net income |
|
$ |
0.31 |
|
$ |
1.43 |
|
$ |
0.64 |
|
$ |
(1.00 |
) |
Stock price |
|
|
|
|
|
|
|
|
|
|
|
|
|
| |
TDS Common Shares |
|
|
|
|
|
|
|
|
|
|
|
|
|
| |
|
High |
|
$ |
39.90 |
|
$ |
41.40 |
|
$ |
44.25 |
|
$ |
55.22 |
|
| |
|
Low |
|
|
35.14 |
|
|
37.02 |
|
|
39.17 |
|
|
41.90 |
|
| |
|
Quarter-end close |
|
|
39.44 |
|
|
41.40 |
|
|
42.10 |
|
|
54.33 |
|
| |
TDS Special Common Shares |
|
|
|
|
|
|
|
|
|
|
|
|
|
| |
|
High |
|
|
37.98 |
|
|
39.15 |
|
|
42.67 |
|
|
50.76 |
|
| |
|
Low |
|
|
33.95 |
|
|
36.45 |
|
|
38.97 |
|
|
40.10 |
|
| |
|
Quarter-end close |
|
|
37.75 |
|
|
38.90 |
|
|
40.85 |
|
|
49.60 |
|
| Dividends paid |
|
$ |
0.0925 |
|
$ |
0.0925 |
|
$ |
0.0925 |
|
$ |
0.0925 |
|
Telephone and Data Systems, Inc. and Subsidiaries - Shareholder Information
TDS Stock and dividend information
TDS'
Common Shares are listed on the American Stock Exchange ("AMEX") under
the symbol "TDS". TDS' Special Common Shares are listed on the AMEX
under the symbol "TDS.S". As of January 31, 2008, TDS Common
Shares were held by 1,736 record owners, the Special Common Shares were
held by 1,783 record owners, and the Series A Common Shares were
held by 78 record owners.
TDS
has paid cash dividends on its common stock since 1974, and paid
dividends of $0.39 per Common, Special Common and Series A Common
Share during 2007. During 2006, TDS paid dividends of $0.37 per Common,
Special Common and Series A Common Share.
The
Common Shares of United States Cellular Corporation, an 80.8%-owned
subsidiary of TDS, are listed on the AMEX under the symbol "USM".
See
"Consolidated Quarterly Information (Unaudited)" for information on the
high and low trading prices of the TDS Common Shares and TDS Special
Common Shares for 2007 and 2006.
Stock performance graph
The
following chart graphs the performance of the cumulative total return
to shareholders (stock price appreciation plus dividends) during the
previous five years in comparison to returns of the Standard &
Poor's 500 Composite Stock Price Index, the Dow Jones U.S.
Telecommunications Index and the Old Peer Group. The Old Peer Group
index was constructed specifically for TDS and included the following
telecommunications companies for the years 2002 through 2006: ALLTEL
Corp., Centennial Communications Corp., CenturyTel, Inc., Citizens
Communications Co. (Series B), Dobson Communications Corp.,
and Telephone and Data Systems, Inc. ALLTEL Corp. and Dobson
Communications Corp. were excluded from the peer group index in 2007 as
they were acquired by other companies during 2007. As a result of
acquisitions of ALLTEL Corp. and Dobson Communications Corp. in 2007,
TDS believes that the old peer group it had used previously has too few
participants and has selected the Dow Jones U.S. Telecommunications
Index, a published industry index for purposes of the performance graph
shown below. The Dow Jones U.S. Telecommunications Index is currently
composed of the following companies: AT&T Inc.,
CenturyTel Inc., Cincinnati Bell Inc., Citizens
Communications Co. (Series B), Embarq Corp., IDT Corp.
(Class B), Leap Wireless International Inc., Leucadia
National Corp., Level 3 Communications Inc., MetroPCS
Communications Inc., NII Holdings Inc., Qwest Communications
International Inc., RCN Corp., Sprint Nextel Corp., Telephone and
Data Systems, Inc. (TDS and TDS.S), Time Warner
Telecom, Inc., United States Cellular Corporation, Verizon
Communications Inc., Virgin Media Inc. and Windstream Corp.
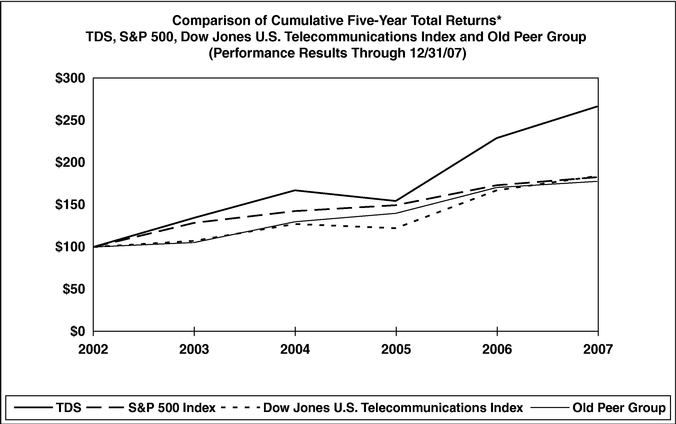
|
|
2002 |
|
2003 |
|
2004 |
|
2005 |
|
2006 |
|
2007 |
| Telephone and Data Systems, Inc. |
|
$ |
100 |
|
$ |
134.65 |
|
$ |
167.10 |
|
$ |
154.47 |
|
$ |
229.16 |
|
$ |
266.82 |
| S&P 500 Index |
|
|
100 |
|
|
128.68 |
|
|
142.69 |
|
|
149.70 |
|
|
173.34 |
|
|
182.86 |
| Dow Jones U.S. Telecommunications Index |
|
|
100 |
|
|
107.33 |
|
|
127.40 |
|
|
122.30 |
|
|
167.35 |
|
|
184.15 |
| Old Peer Group |
|
|
100 |
|
|
105.25 |
|
|
129.91 |
|
|
139.86 |
|
|
170.59 |
|
|
177.95 |
Assumes
$100.00 invested at the close of trading on the last trading day of
2002, in TDS Common Shares, S&P 500 Index, the Dow Jones U.S.
Telecommunications Index and the Old Peer Group.
After
the close of business on May 13, 2005, TDS distributed a stock
dividend of one Special Common Share of TDS with respect to each
outstanding TDS Common Share and Series A Common Share. For
purposes of the stock performance chart, the performance of TDS for all
periods presented prior to May 13, 2005 is represented by the TDS
Common Shares, and for the period between May 13, 2005 and
December 31, 2007 includes both the TDS Common Shares and TDS
Special Common Shares. The last closing price of TDS Common Shares on
May 13, 2005 prior to the impact of the stock dividend was $74.57.
The closing price on May 16, 2005, the first trading day after the
stock dividend, was $38.19 for the TDS Common Shares and $36.25 for the
TDS Special Common Share, or a total of $74.44. The closing price on
December 31, 2007, the last trading day of 2007, was $62.60 for
the TDS Common Shares and $57.60 for the TDS Special Common Shares, or
a total of $120.20.
Dividend reinvestment plan
Our
dividend reinvestment plans provides our common and preferred
shareholders with a convenient and economical way to participate in the
future growth of TDS. Common, Special Common and preferred shareholders
of record owning ten (10) or more shares may purchase Common Shares (in
the case of Common and Preferred shareholders) and Special Common
Shares (in the case of Special Common shareholders) with their
reinvested dividends at a five percent discount from market price. Shares
may also be purchased, at market price, on a monthly basis through
optional cash payments of up to $5,000 in any calendar quarter. The
initial ten (10) shares cannot be purchased directly from TDS. An
authorization card and prospectus will be mailed automatically by the
transfer agent to all registered record holders with ten (10) or more
shares. Once enrolled in the plan, there are no brokerage commissions
or service charges for purchases made under the plan.
Investor relations
Our
annual report, Form 10-K, prospectuses and news releases are
available free of charge upon request. These materials may be obtained
either online through the "Info Request" feature of the Investor
Relations section of TDS' web site (www.teldta.com), or by directly
contacting TDS' Investor Relations Department at the address listed
below.
Inquiries
concerning lost, stolen or destroyed certificates, dividends,
consolidation of accounts, transferring of shares, or name and address
changes, should be directed to:
Telephone
and Data Systems, Inc.
Julie Mathews
Manager–Investor Relations
30 North LaSalle Street, Suite 4000
Chicago, IL 60602
312.592.5341
312.630.1908 (fax)
julie.mathews@teldta.com
Our
annual report, filings with the Securities and Exchange Commission,
news releases and other investor information is also available in the
Investor Relations section of TDS' web site (www.teldta.com). General
inquiries by investors, securities analysts and other members of the
investment community should be directed to:
Telephone
and Data Systems, Inc.
Mark Steinkrauss
Vice President–Corporate Relations
30 North LaSalle Street, Suite 4000
Chicago, IL 60602
312.592.5384
312.630.1908 (fax)
mark.steinkrauss@teldta.com
Directors and executive officers
See
"Election of Directors" and "Executive Officers" sections of the Proxy
Statement for the 2008 Annual Meeting.
Principal counsel
Sidley Austin LLP, Chicago, Illinois
Transfer agent
ComputerShare Investor Services
2 North LaSalle Street, 3rd Floor
Chicago, IL 60602
877.337.1575
Independent registered public accounting firm
PricewaterhouseCoopers LLP
Visit
TDS' web site at www.teldta.com
|
|
|
|
|
|
|