
| (U.S. dollars in millions, except per share and per retail square foot amounts) | Fiscal 2007 (1) |
Fiscal 2006 |
Fiscal 2005 (2) |
|
| Revenue | $35,934 |
$30,848 |
$27,433 |
|
| Comparable store sales % gain | 5.0% |
4.9% |
4.3% |
|
| Gross profit as % of revenue | 24.4% |
25.0% |
23.7% |
|
| SG&A as % of revenue | 18.8% |
19.7% |
18.4% |
|
| Operating income as % of revenue | 5.6% |
5.3% |
5.3% |
|
| Earnings from continuing operations | $ 1,377 |
$ 1,140 |
$ 934 |
|
| Net earnings | $ 1,377 |
$ 1,140 |
$ 984 |
|
| Diluted earnings per share—continuing operations | $ 2.79 |
$ 2.27 |
$ 1.86 |
|
| Diluted earnings per share | $ 2.79 |
$ 2.27 |
$ 1.96 |
|
| Cash, cash equivalents and short-term investments | $ 3,793 |
$ 3,789 |
$ 3,348 |
|
| Debt-to-capitalization ratio (3) | 9% |
10% |
12% |
|
| Cash dividends per share declared and paid | $ 0.36 |
$ 0.31 |
$ 0.28 |
|
| Value of common shares repurchased | $ 599 |
$ 772 |
$ 200 |
|
| Total retail square footage (in thousands) (4) | 41,885 |
34,390 |
31,604 |
|
| Revenue per retail square foot (5) | $ 936 |
$ 941 |
$ 905 |
|
| Number of stores: at period end | ||||
| Best Buy—U.S. | 822 |
742 |
668 |
|
| Magnolia Audio Video | 20 |
20 |
20 |
|
| Pacific Sales | 14 |
– |
– |
|
| Future Shop | 121 |
118 |
114 |
|
| Best Buy—Canada | 47 |
44 |
30 |
|
| Five Star | 135 |
– |
– |
|
| Best Buy—China | 1 |
– |
– |
|
|
||||
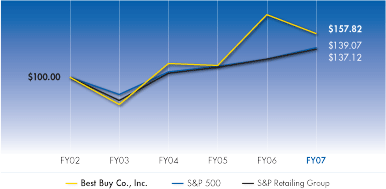
Total shareholder return Cumulative total return among Best Buy Co., Inc.; the S&P 500 Index; |
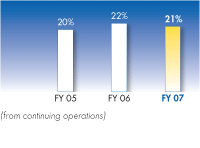
Return on invested capital We continue to generate a strong ROIC as we invest |
||
 |
 |
||
Source: Research Data Group |