
Page 29 - 2017 AMETEK Annual Report (Interactive) Updated mobile
P. 29
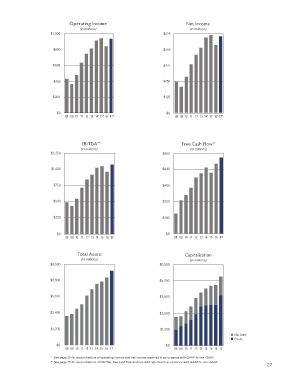
Operating Income                                 Net Income
                                  (In millions)                                 (In millions)
                      $1,000                                         $625


                       $800                                          $500


                       $600                                          $375


                       $400                                          $250


                       $200                                          $125


                         $0                                            $0
                            08 09 10 11 12 13 14* 15* 16* 17*             08 09 10 11 12 13 14* 15* 16* 17*


                                     EBITDA **                               Free Cash Flow **
                                   (In millions)                                 (In millions)
                      $1,250                                         $800


                      $1,000                                         $640


                       $750                                          $480


                       $500                                          $320


                       $250                                          $160


                         $0                                           $0
                            08 09 10 11 12 13 14 15 16 17                 08 09 10 11 12 13 14 15 16 17


                                 Total Assets                                 Capitalization
                                   (In millions)                                (In millions)
                      $8,500                                        $6,500


                      $6,800                                        $5,200


                      $5,100                                        $3,900


                      $3,400                                        $2,600


                      $1,700                                        $1,300
                                                                                                       Net Debt
                                                                                                    Equity
                         $0                                           $0
                            08 09 10 11 12 13 14 15 16 17                 08 09 10 11 12 13 14 15 16 17

                      *  See page 26 for reconciliations of operating income and net income reported in accordance with GAAP to non-GAAP.
                      ** See page 25 for reconciliations of EBITDA, free cash flow and net debt reported in accordance with GAAP to non-GAAP.
                                                                                                                 27