
Page 26 - 2017 AMETEK Annual Report (Interactive) Updated mobile
P. 26
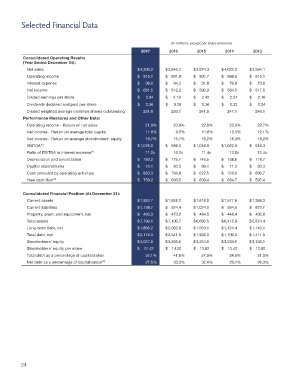
Selected Financial Data


                                                                        (In millions, except per share amounts)
                                                            2017        2016       2015        2014        2013
           Consolidated Operating Results
           (Year Ended December 31):
             Net sales                                     $ 4,300.2    $ 3,840.1    $ 3,974.3    $ 4,022.0    $ 3,594.1
             Operating income                              $  915.1    $  801.9    $  907.7    $  898.6    $  815.1
             Interest expense                              $  98.0    $   94.3    $   91.8    $   79.9    $   73.6
             Net income                                    $  681.5    $  512.2    $  590.9    $  584.5    $  517.0
             Diluted earnings per share                    $       2.94    $       2.19  $       2.45    $       2.37    $       2.10
             Dividends declared and paid per share         $       0.36    $       0.36  $       0.36    $       0.33    $       0.24
             Diluted weighted average common shares outstanding   231.8       233.7       241.6       247.1       246.1
           Performance Measures and Other Data:
             Operating income - Return on net sales           21.3%       20.9%      22.8%       22.3%       22.7%
              Net income - Return on average total capital              11.6%               9.5%              11.6%             12.3%             12.1%
             Net income - Return on average stockholders’ equity  18.7%   15.7%      18.2%       18.3%       18.2%
                  (1)
             EBITDA                                        $ 1,076.0    $  966.0    $ 1,046.9    $  1,022.6    $  916.3
             Ratio of EBITDA to interest expense (1)          11.0x       10.2x      11.4x       12.8x       12.4x
             Depreciation and amortization                 $  183.2    $  179.7    $  149.5    $  138.6    $  118.7
             Capital expenditures                          $  75.1    $   63.3    $   69.1    $   71.3    $   63.3
             Cash provided by operating activities         $  833.3    $  756.8    $  672.5    $  726.0    $  660.7
                       (2)
             Free cash flow                                $  758.2    $  693.5    $  603.4    $  654.7    $  597.4

           Consolidated Financial Position (At December 31):
             Current assets                                $ 1,934.7    $ 1,928.2    $ 1,618.8    $ 1,577.6    $ 1,368.3
             Current liabilities                           $ 1,138.7    $  924.4    $ 1,024.0    $  934.5    $  872.7
             Property, plant, and equipment, net           $  493.3    $  473.2    $  484.5    $  448.4    $  402.8
             Total assets                                  $ 7,796.1    $ 7,100.7    $ 6,660.5    $ 6,415.9    $ 5,874.4
             Long-term debt, net                           $ 1,866.2    $ 2,062.6    $ 1,553.1    $ 1,424.4    $ 1,140.1
             Total debt, net                               $ 2,174.3    $ 2,341.6    $ 1,938.0    $ 1,709.0    $ 1,411.5
             Stockholders’ equity                          $ 4,027.6    $ 3,256.5    $ 3,254.6    $ 3,239.6    $ 3,136.1
             Stockholders’ equity per share                $    17.42    $                                                         14.20    $                                                         13.82    $                                                         13.42    $    12.80
             Total debt as a percentage of capitalization     35.1%       41.8%      37.3%       34.5%       31.0%
                                            (3)
             Net debt as a percentage of capitalization       27.5%       33.3%      32.4%       29.1%       26.3%


          24