
Page 27 - 2017 AMETEK Annual Report (Interactive) Updated mobile
P. 27
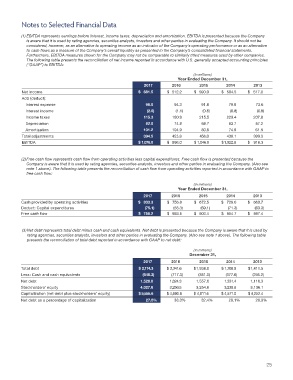
Notes to Selected Financial Data


          (1) EBITDA represents earnings before interest, income taxes, depreciation and amortization. EBITDA is presented because the Company
            is aware that it is used by rating agencies, securities analysts, investors and other parties in evaluating the Company. It should not be
            considered, however, as an alternative to operating income as an indicator of the Company’s operating performance or as an alternative
            to cash flows as a measure of the Company’s overall liquidity as presented in the Company’s consolidated financial statements.
            Furthermore, EBITDA measures shown for the Company may not be comparable to similarly titled measures used by other companies.
            The following table presents the reconciliation of net income reported in accordance with U.S. generally accepted accounting principles
            (“GAAP”) to EBITDA:

                                                                                  (In millions)
                                                                           Year Ended December 31,
                                                               2017       2016       2015       2014           2013
          Net income                                         $    681.5     $   512.2     $   590.9       $    584.5      $    517.0
          Add (deduct):
            Interest expense                                       98.0            94.3           91.8             79.9            73.6
            Interest income                                         (2.0)            (1.1)         (0.8)            (0.8)            (0.8)
            Income taxes                                           115.3          180.9            215.5          220.4          207.8
            Depreciation                                           82.0              74.8          68.7            63.7            57.2
            Amortization                                         101.2          104.9         80.8            74.9            61.5
          Total adjustments                                    394.5          453.8                   456.0            438.1          399.3
          EBITDA                                                     $ 1,076.0    $   966.0    $ 1,046.9        $ 1,022.6     $     916.3


          (2) Free cash flow represents cash flow from operating activities less capital expenditures. Free cash flow is presented because the
            Company is aware that it is used by rating agencies, securities analysts, investors and other parties in evaluating the Company. (Also see
            note 1 above). The following table presents the reconciliation of cash flow from operating activities reported in accordance with GAAP to
            free cash flow:

                                                                                  (In millions)
                                                                           Year Ended December 31,
                                                              2017        2016       2015       2014          2013
          Cash provided by operating activities               $   833.3        $   756.8       $     672.5        $     726.0        $     660.7
          Deduct: Capital expenditures                            (75.1)            (63.3)           (69.1)           (71.3)          (63.3)
          Free cash flow                                       $      758.2         $    693.5        $    603.4        $     654.7      $     597.4


          (3) Net debt represents total debt minus cash and cash equivalents. Net debt is presented because the Company is aware that it is used by
            rating agencies, securities analysts, investors and other parties in evaluating the Company. (Also see note 1 above). The following table
            presents the reconciliation of total debt reported in accordance with GAAP to net debt:

                                                                                  (In millions)
                                                                                December 31,
                                                              2017        2016       2015       2014          2013
          Total debt                                        $        2,174.3          $ 2,341.6         $  1,938.0          $  1,709.0       $  1,411.5

          Less: Cash and cash equivalents                         (646.3)            (717.3)           (381.0)          (377.6)          (295.2)
          Net debt                                                1,528.0           1,624.3          1,557.0         1,331.4        1,116.3
          Stockholders’ equity                                 4,027.6           3,256.5              3,254.6            3,239.6          3,136.1
          Capitalization (net debt plus stockholders’ equity)    $  5,555.6          $ 4,880.8         $    4,811.6         $  4,571.0    $  4,252.4
          Net debt as a percentage of capitalization            27.5%                33.3%             32.4%             29.1%            26.3%


                                                                                                                25