About Bank of America // Bank of America Corporation — Financial Highlights
Bank of America Corporation (NYSE: BAC) is headquartered in Charlotte, N.C. As of December 31, 2011, we operated in all 50 states, the District of Columbia and more than 40 countries. Through our banking and various non-banking subsidiaries throughout the United States and in selected international markets, we provide a diversified range of banking and non-banking financial services and products through six business segments: Deposits, Card Services, Consumer Real Estate Services, Global Commercial Banking, Global Banking & Markets and Global Wealth & Investment Management. Bank of America is a member of the Dow Jones Industrial Average.
FINANCIAL HIGHLIGHTS (in millions, except per share information)
| For the year |
2011 |
2010 |
2009 |
| Revenue, net of interest expense (FTE basis)Footnote 1 |
$ 94,426 |
$ 111,390 |
$ 120,944 |
| Net income (loss) |
1,446 |
(2,238) |
6,276 |
| Net income, excluding goodwill impairment chargesFootnote 2 |
4,630 |
10,162 |
n/a |
| Earnings (loss) per common share |
0.01 |
(0.37) |
(0.29) |
| Diluted earnings (loss) per common share |
0.01 |
(0.37) |
(0.29) |
| Diluted earnings per common share, excluding goodwill impairment chargesFootnote 2 |
0.32 |
0.86 |
n/a |
| Dividends paid per common share |
0.04 |
0.04 |
0.04 |
| Return on average assets |
0.06% |
n/m |
0.26% |
| Return on average tangible shareholders' equityFootnote 1 |
0.96 |
n/m |
4.18 |
| Efficiency ratio (FTE basis)Footnote 1 |
85.01 |
74.61 |
55.16 |
| Average diluted common shares issued and outstanding |
10,255 |
9,790 |
7,729 |
| At year-end |
2011 |
2010 |
2009 |
| Total loans and leases |
$ 926,200 |
$ 940,440 |
$ 900,128 |
| Total assets |
2,129,046 |
2,264,909 |
2,230,232 |
| Total deposits |
1,033,041 |
1,010,430 |
991,611 |
| Total shareholders' equity |
230,101 |
228,248 |
231,444 |
| Book value per common share |
20.09 |
20.99 |
21.48 |
| Tangible book value per common shareFootnote 3 |
12.95 |
12.98 |
11.94 |
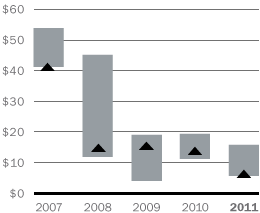
| Market price per common share |
5.56 |
13.34 |
15.06 |
| Common shares issued and outstanding |
10,536 |
10,085 |
8,650 |
| Tier 1 common capital ratio |
9.86% |
8.60% |
7.81% |
| Tangible common equity ratioFootnote 3 |
6.64 |
5.99 |
5.56 |
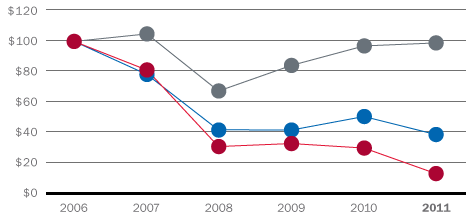
Total Cumulative Shareholder ReturnFootnote 4

| December 31 | 2006 | 2007 | 2008 | 2009 | 2010 | 2011 |
| BANK OF AMERICA CORPORATION | $100 | $81 | $30 | $32 | $29 | $12 |
| S&P 500 COMP | $100 | $105 | $67 | $84 | $97 | $99 |
| KBW BANK INDEX | $100 | $78 | $41 | $41 | $50 | $38 |

