Bank of America Corporation (NYSE: BAC) is a publicly traded company headquartered in Charlotte, NC, that operates throughout the United States and 44 foreign countries. The corporation provides a diversified range of banking and nonbanking financial services and products domestically and internationally through three business segments: Global Consumer & Small Business Banking, Global Corporate & Investment Banking and Global Wealth & Investment Management.
(Dollars in millions, except per share information)
| Year Ended Dec. 31 | ||
|---|---|---|
| For the year | 2006 | 2005 |
| Revenue* | $74,247 | $56,923 |
| Net income | 21,133 | 16,465 |
| Shareholder value added | 9,121 | 6,594 |
| Earnings per common share | 4.66 | 4.10 |
| Diluted earnings per common share | 4.59 | 4.04 |
| Dividends paid per common share | 2.12 | 1.90 |
| Return on average assets |
1.44 % |
1.30 % |
|
Return on average common shareholders' equity
|
16.27 % |
16.51 % |
| Efficiency ratio* |
47.94 % |
50.38 % |
|
Average common shares issued and outstanding (in millions)
|
4,527 | 4,009 |
| At year end | 2006 | 2005 |
|---|---|---|
| Total assets | $1,459,737 | $1,291,803 |
| Total loans and leases | 706,490 | 573,791 |
| Total deposits | 693,497 | 634,670 |
| Total shareholders' equity | 135,272 | 101,533 |
| Book value per common share | 29.70 | 25.32 |
|
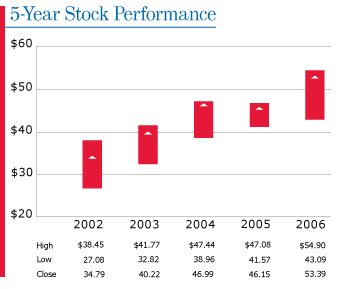
Market price per share of common stock
|
53.39 | 46.15 |
|
Common shares issued and outstanding (in millions)
|
4,458 | 4,000 |
*Fully taxable-equivalent basis
**All Other consists primarily of Equity Investments and Other. For more information, refer to All Other section in the Management's Discussion and Analysis.
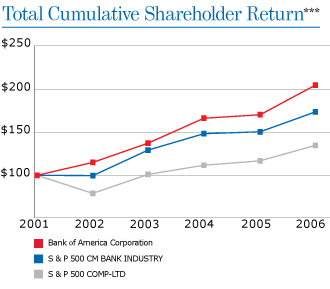
***The graph compares the yearly change in the corporation's cumulative total stockholders' return on its common stock with (i) Standard & Poor's 500 Index and (ii) Standard & Poor's 500
Commercial Banks Index for the years ended 2002 to 2006. The graph assumes an initial investment of $100 at the end of 2001 and the reinvestment of all dividends during the periods indicated.
© 2007 Bank of America Corporation. All rights reserved.