Equity Incentive Plans
Equity Incentive Plans
The committee and management believe that equity compensation is a critical component of a total compensation package that helps Intel recruit, retain, and motivate the employees needed for the present and future success of the company. In 2006, Intel began granting employees RSUs in addition to stock options. Stock options provide actual economic value to the holder if the price of Intel stock has increased from the grant date at the time the option is exercised. In contrast, RSUs have economic value when they vest even if the stock price declines or stays flat. Stock options motivate executive officers by providing more potential upside. RSUs assist the company in retaining executive officers because they have more stable value.
The use of RSUs also assists in maintaining the Board's long-term goal that equity grants not result in an average annual dilution rate that exceeds 2%. Because the grant date fair value of each RSU that we grant is greater than the grant date fair value of each stock option, employees on average receive fewer RSUs now than stock options in the past. Most equity grants occur on an annual basis in connection with the annual performance review and compensation adjustment cycle. In general, annual stock options and RSUs vest in 25% annual increments beginning one year from the date of grant. For all employees including executive officers, Intel uses pre-established quarterly dates for the formal granting of equity awards during the year. With limited exceptions, these dates typically occur shortly after publication of Intel's quarterly earnings releases.
For Intel's executive officers, the committee grants a combination of annual equity grants targeted to be below market average in value, and long-term equity grants, which in combination with the annual grants are intended to approximate the 65th percentile of the peer group. The committee believes that the 65th percentile is an appropriate target because the majority of equity awards granted to executive officers are in the form of stock options, which have no economic value unless the market price of Intel's common stock increases. Executive officers are eligible to receive long-term grants that generally have a five-year cliff-vesting schedule, meaning that 100% of the grant vests on the fifth anniversary of the date that the grants are awarded. The annual equity grants and long-term equity grants are both generally a mix of stock options and RSUs based on their grant date fair values as calculated under SFAS No. 123(R). In 2007, the committee approved management's recommendation to increase the RSU mix for all employees, including moving almost all executive officers from an 80/20 split to a 70/30 split. The committee and Mr. Otellini believed that increasing the use of RSUs would help with retention and to make Intel's compensation package more competitive with the companies in the peer group.
The committee determines the amount of annual equity grants and long-term grants based on its subjective consideration of factors such as relative job scope, expected future contributions to the growth and development of the company, and the competitiveness of grants relative to the peer group. When evaluating future contributions, the committee projects the value of the executive officer's future performance based on the officer's expected career development. The equity grants are meant to motivate the executive officer to stay at Intel and deliver the expected future performance.
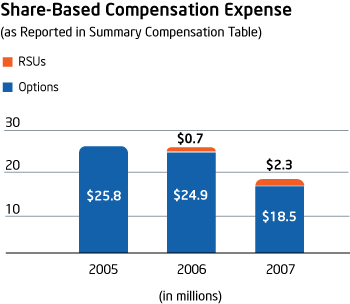
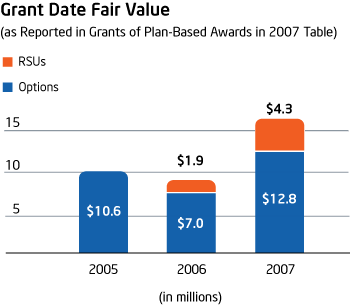
Because equity compensation is more complicated than cash compensation, there are a number of ways to present the costs to Intel and the benefits to the listed officers resulting from Intel's equity compensation program. The following graphs and table present five different views of Intel's equity compensation program. The first two graphs are based on the reporting of share-based compensation expense in Intel's financial statements. The table following these graphs shows some of the key metrics (dilution, burn rate, and overhang) that the committee and Intel's management use to measure how effectively Intel manages its equity compensation program. The third and fourth graphs show how the economic value that the listed officer receives from equity compensation varies with changes to Intel's stock price by showing the listed officers' realized and unrealized gains and losses.
The following graph shows the SFAS No. 123(R) expense that Intel incurred during each year for financial statement purposes for grants to listed officers. The amount of expense that Intel incurs each year relates to a portion of many years worth of equity awards. For example, expense related to annual stock options granted in April 2007 would typically be incurred as the award vests, with expense in 2007, 2008, 2009, 2010, and the beginning of 2011. SFAS No. 123(R) expense for the listed officers declined 19% in 2007 compared to 2006, primarily because the number of equity awards that completed vesting exceeded the number of new equity awards granted.

The graph below shows the expense for awards granted to listed officers during each year for financial statement purposes. The grant date fair value of annual and long-term equity awards granted to listed officers in January and April 2007 totaled $17.1 million, and this expense will be incurred over the service period as the awards vest in 2008, 2009, 2010, 2011, and 2012. The grant date fair value of equity awards that the committee granted in 2007 increased 92% compared to 2006, with the majority of the increase ($5.3 million) due to the granting of long-term equity awards.

While the two graphs above focus on how our equity compensation program impacts our financial statements, there are other key metrics that the committee and Intel's management use to determine the costs to stockholders of Intel's equity compensation program. The following table shows how these metrics have changed over the past three years. We define the metrics as follows:
- Dilution is total equity awards granted (less cancellations) divided by shares outstanding at the beginning of the year.
- Burn rate is similar to dilution, but does not take cancellations into account.
- Overhang is equity awards outstanding but not exercised plus equity awards available to be granted, divided by total equity awards outstanding at the end of the year.
Equity Compensation Key Metrics
| 2007 (%) |
2006 (%) |
2005 (%) |
||||
|---|---|---|---|---|---|---|
| Dilution | — | .2 | 1.3 | |||
| Burn rate | 1.0 | 1.4 | 1.9 | |||
| Overhang | 16.2 | 17.8 | 19.2 |
By policy, the committee limits grants to listed officers to no more than 5% of the total equity awards granted in any one year. The dilution, burn rate, and overhang amounts reported above are for all equity awards, not just those awarded to listed officers. The goal of the committee and Intel's management is to limit annual dilution to less than 2%.
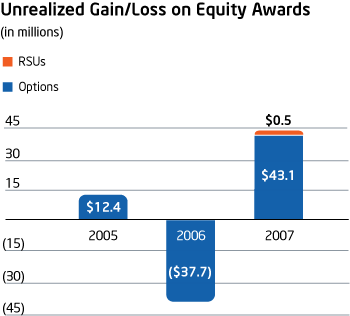
While the graphs and table above show some of the costs of Intel's equity compensation program, the next two graphs show the economic benefit of equity compensation to the listed officers. Additionally, the graphs show how the value of the listed officers' equity awards is directly affected by changes in the price of Intel common stock. During 2007, the price of Intel common stock increased 32% from the beginning of the fiscal year to year-end. This 32% increase translated into an unrealized gain of $43.6 million for the listed officers and illustrates the performance-based nature of Intel's equity compensation program. To promote comparability from year to year, the Unrealized Gain/Loss on Equity Awards graph includes only awards that were outstanding at both the beginning and the end of the fiscal year (awards that were granted or that were exercised or settled during the year are excluded).

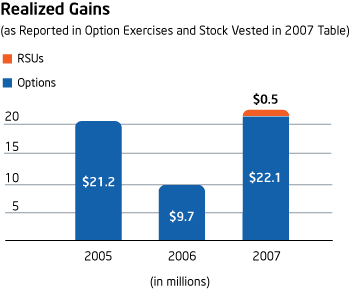
The Realized Gains graph below shows the aggregate value of the stock options that were exercised and RSUs that were settled by the listed officers for each of the past three years. This graph shows the gains that the listed officers actually received from their equity awards, while the Unrealized Gain/Loss on Equity Awards graph shows unrealized gains measured as of the end of each fiscal year (which may or may not ever be realized).

Employee Stock Purchase Plan
Intel's employee stock purchase plan allows employees to acquire Intel stock at a discount price and is intended to encourage employee stock ownership. This plan has a six-month look-back and allows participants to buy Intel stock at a 15% discount to the market price with up to 10% of their salary and performance-based cash compensation (up to $25,000).
