Trading Risk Management
Trading-related revenues represent the amount earned from trading positions which are taken in a diverse range of financial instruments and markets. Trading account assets and liabilities and derivative positions are reported at fair value. For more information on fair value, see Complex Accounting Estimates. Trading Account Profits represent the net amount earned from our trading positions and, as reported in the Consolidated Statement of Income, do not include the Net Interest Income recognized on trading positions, or the related funding charge or benefit. Trading Account Profits can be volatile and are largely driven by general market conditions and customer demand. Trading Account Profits are dependent on the volume and type of transactions, the level of risk assumed, and the volatility of price and rate movements at any given time within the ever-changing market environment.
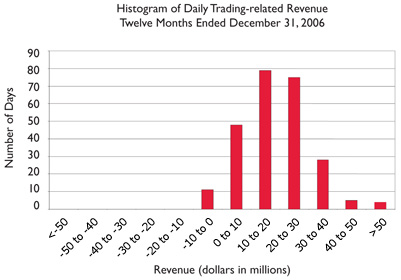
The histogram of daily revenue or loss below is a graphic depiction of trading volatility and illustrates the daily level of trading-related revenue for 2006. Trading-related revenue encompasses proprietary trading and customer-related activities. During 2006, positive trading-related revenue was recorded for 96 percent of the trading days. Furthermore, there were no trading days with losses greater than $10 million and the largest loss was $10 million. This can be compared to 2005, where positive trading-related revenue was recorded for 86 percent of the trading days and only four percent of the total trading days had losses greater than $10 million and the largest loss was $55 million.
To evaluate risk in our trading activities, we focus on the actual and potential volatility of individual positions as well as portfolios. At a portfolio and corporate level, we use VAR modeling and stress testing. VAR is a key statistic used to measure market risk. In order to manage day-to-day risks, VAR is subject to trading limits both for our overall trading portfolio and within individual businesses. Senior management reviews and evaluates the results of these limit excesses.
A VAR model simulates the value of a portfolio under a range of hypothetical scenarios in order to generate a distribution of potential gains and losses. The VAR represents the worst loss the portfolio is expected to experience with a given level of confidence. VAR depends on the volatility of the positions in the portfolio and on how strongly their risks are correlated. Within any VAR model, there are significant and numerous assumptions that will differ from company to company. Our VAR model uses a historical simulation approach based on three years of historical data and assumes a 99 percent confidence level. Statistically, this means that losses will exceed VAR, on average, one out of 100 trading days, or two to three times each year. Actual losses did not exceed VAR in 2006 and exceeded VAR twice in 2005.
The assumptions and data underlying our VAR model are updated on a regular basis. In addition, the predictive accuracy of the model is periodically tested by comparing actual losses for individual businesses with the losses predicted by the VAR model. Senior management reviews and evaluates the results of these tests.
The following graph shows daily trading-related revenue and VAR for 2006.
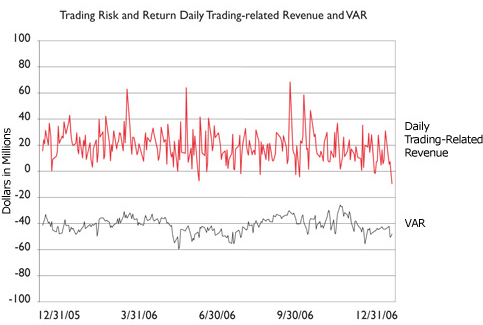
Table 28 presents average, high and low daily VAR for the twelve months ended December 31, 2006 and 2005.
| Twelve Months Ended December 31 | ||||||
|---|---|---|---|---|---|---|
| 2006 | 2005 | |||||
| VAR | VAR | |||||
| (Dollars in millions) | Average | High (1) | Low (1) | Average | High (1) | Low (1) |
| Foreign exchange |
$ |
$ |
$ |
$ |
$ |
$ |
| Interest rate | 18.5 | 50.0 | 7.3 | 24.7 | 58.2 | 10.8 |
| Credit | 26.8 | 36.7 | 18.4 | 22.7 | 33.4 | 14.4 |
| Real estate/mortgage | 8.4 | 12.7 | 4.7 | 11.4 | 20.7 | 6.5 |
| Equities | 18.8 | 39.6 | 9.9 | 18.1 | 35.1 | 9.6 |
| Commodities | 6.1 | 9.9 | 3.4 | 6.6 | 10.6 | 3.5 |
| Portfolio diversification | (45.5) | — | — | (47.3) | — | — |
|
Total market-based trading portfolio (2)
|
$ |
$ |
$ |
$ |
$ |
$ |
Stress Testing
Because the very nature of a VAR model suggests results can exceed our estimates, we also "stress test" our portfolio. Stress testing estimates the value change in our trading portfolio that may result from abnormal market movements. Various types of stress tests are run regularly against the overall trading portfolio and individual businesses. Historical scenarios simulate the impact of price changes which occurred during a set of extended historical market events. The results of these scenarios are reported daily to senior management. During 2006, the largest losses among these scenarios ranged from $7 million to $591 million. Hypothetical scenarios evaluate the potential impact of extreme but plausible events. These scenarios are developed to address perceived vulnerabilities in the market and in our portfolios, and are periodically updated. Senior management reviews and evaluates results of these scenarios monthly. During 2006, the largest losses among these scenarios ranged from $441 million to $734 million. Worst-case losses, which represent the most extreme losses in our daily VAR calculation, are reported daily. Finally, desk-level stress tests are performed daily for individual businesses. These stress tests evaluate the potential adverse impact of large moves in the market risk factors to which those businesses are most sensitive.