- Page 1
- Page 2
- Page 3
- Page 4
- Page 5
- Page 6
- Page 7
- Page 8
- Page 9
- Page 10
- Page 11
- Page 12
- Page 13
- Page 14
- Page 15
- Page 16
- Page 17
- Page 18
- Page 19
- Page 20
- Page 21
- Page 22
- Page 23
- Page 24
- Page 25
- Page 26
- Page 27
- Page 28
- Page 29
- Page 30
- Page 31
- Page 32
- Page 33
- Page 34
- Page 35
- Page 36
- Page 37
- Page 38
- Page 39
- Page 40
- Page 41
- Page 42
- Page 43
- Page 44
- Page 45
- Page 46
- Page 47
- Page 48
- Page 49
- Page 50
- Page 51
- Page 52
- Page 53
- Page 54
- Page 55
- Page 56
- Page 57
- Page 58
- Page 59
- Page 60
- Page 61
- Page 62
- Page 63
- Page 64
- Page 65
- Page 66
- Page 67
- Page 68
- Page 69
- Page 70
- Page 71
- Page 72
- Page 73
- Page 74
- Page 75
- Page 76
- Page 77
- Page 78
- Page 79
- Page 80
- Flash version
© UniFlip.com
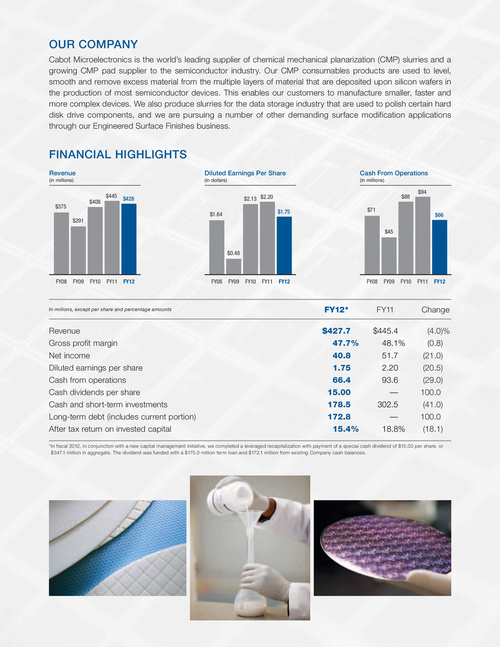
ouR compAny
Cabot Microelectronics is the world’s leading supplier of chemical mechanical planarization (CMP) slurries and a growing CMP pad supplier to the semiconductor industry. Our CMP consumables products are used to level, smooth and remove excess material from the multiple layers of material that are deposited upon silicon wafers in the production of most semiconductor devices. This enables our customers to manufacture smaller, faster and more complex devices. We also produce slurries for the data storage industry that are used to polish certain hard disk drive components, and we are pursuing a number of other demanding surface modification applications through our Engineered Surface Finishes business.
FinAnciAl HigHligHts
Revenue
(in millions)
Diluted Earnings Per Share
(in dollars)
Cash From Operations
(in millions)
$375 $291
$408
$445
$428 $1.64
$2.13 $2.20 $1.75 $71
$88
$94
$66 $45
$0.48
FY08
FY09
FY10
FY11
FY12
FY08
FY09
FY10
FY11
FY12
FY08
FY09
FY10
FY11
FY12
In millions, except per share and percentage amounts
FY12* $427.7 47.7% 40.8 1.75 66.4 15.00 178.5 172.8 15.4%
FY11 $445.4 48.1% 51.7 2.20 93.6 — 302.5 — 18.8%
Change (4.0)% (0.8) (21.0) (20.5) (29.0) 100.0 (41.0) 100.0 (18.1)
Revenue Gross profit margin Net income Diluted earnings per share Cash from operations Cash dividends per share Cash and short-term investments Long-term debt (includes current portion) After tax return on invested capital
*In fiscal 2012, in conjunction with a new capital management initiative, we completed a leveraged recapitalization with payment of a special cash dividend of $15.00 per share, or $347.1 million in aggregate. The dividend was funded with a $175.0 million term loan and $172.1 million from existing Company cash balances.