- Page 1
- Page 2
- Page 3
- Page 4
- Page 5
- Page 6
- Page 7
- Page 8
- Page 9
- Page 10
- Page 11
- Page 12
- Page 13
- Page 14
- Page 15
- Page 16
- Page 17
- Page 18
- Page 19
- Page 20
- Page 21
- Page 22
- Page 23
- Page 24
- Page 25
- Page 26
- Page 27
- Page 28
- Page 29
- Page 30
- Page 31
- Page 32
- Page 33
- Page 34
- Page 35
- Page 36
- Page 37
- Page 38
- Page 39
- Page 40
- Page 41
- Page 42
- Page 43
- Page 44
- Page 45
- Page 46
- Page 47
- Page 48
- Page 49
- Page 50
- Page 51
- Page 52
- Page 53
- Page 54
- Page 55
- Page 56
- Page 57
- Page 58
- Page 59
- Page 60
- Page 61
- Page 62
- Page 63
- Page 64
- Page 65
- Page 66
- Page 67
- Page 68
- Page 69
- Page 70
- Page 71
- Page 72
- Page 73
- Page 74
- Page 75
- Page 76
- Page 77
- Page 78
- Page 79
- Page 80
- Flash version
© UniFlip.com
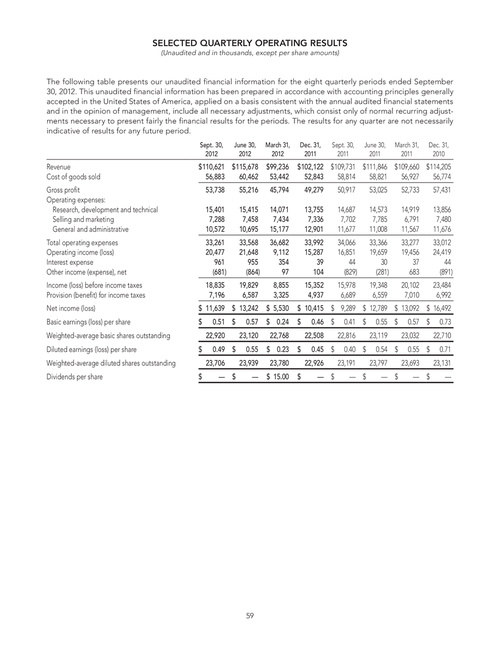
SELECTED QUARTERLY OPERATING RESULTS
(Unaudited and in thousands, except per share amounts)
The following table presents our unaudited financial information for the eight quarterly periods ended September 30, 2012. This unaudited financial information has been prepared in accordance with accounting principles generally accepted in the United States of America, applied on a basis consistent with the annual audited financial statements and in the opinion of management, include all necessary adjustments, which consist only of normal recurring adjustments necessary to present fairly the financial results for the periods. The results for any quarter are not necessarily indicative of results for any future period.
Sept. 30, 2012 June 30, 2012 March 31, 2012 Dec. 31, 2011 Sept. 30, 2011 June 30, 2011 March 31, 2011 Dec. 31, 2010
Revenue Cost of goods sold Gross profit Operating expenses: Research, development and technical Selling and marketing General and administrative Total operating expenses Operating income (loss) Interest expense Other income (expense), net Income (loss) before income taxes Provision (benefit) for income taxes Net income (loss) Basic earnings (loss) per share Weighted-average basic shares outstanding Diluted earnings (loss) per share Weighted-average diluted shares outstanding Dividends per share
$ 110,621 $ 115,678 56,883 60,462 53,738 15,401 7,288 10,572 33,261 20,477 961 (681) 18,835 7,196 $ $ $ 0.51 $ 22,920 0.49 $ 23,706 — $ 55,216 15,415 7,458 10,695 33,568 21,648 955 (864) 19,829 6,587 0.57 23,120 0.55 23,939 —
$99,236 53,442 45,794 14,071 7,434 15,177 36,682 9,112 354 97 8,855 3,325 $ 5,530 $ 0.24 22,768 $ 0.23 23,780 $ 15.00
$ 102,122 $ 109,731 $ 111,846 $ 109,660 $ 114,205 52,843 58,814 58,821 56,927 56,774 49,279 13,755 7,336 12,901 33,992 15,287 39 104 15,352 4,937 $ $ $ 0.46 $ 22,508 0.45 $ 22,926 — $ 50,917 14,687 7,702 11,677 34,066 16,851 44 (829) 15,978 6,689 0.41 $ 22,816 0.40 $ 23,191 — $ 53,025 14,573 7,785 11,008 33,366 19,659 30 (281) 19,348 6,559 0.55 $ 23,119 0.54 $ 23,797 — $ 52,733 14,919 6,791 11,567 33,277 19,456 37 683 20,102 7,010 0.57 $ 23,032 0.55 $ 23,693 — $ 57,431 13,856 7,480 11,676 33,012 24,419 44 (891) 23,484 6,992 0.73 22,710 0.71 23,131 —
$ 11,639 $ 13,242
$ 10,415 $ 9,289 $ 12,789 $ 13,092 $ 16,492
59