- Page 1
- Page 2
- Page 3
- Page 4
- Page 5
- Page 6
- Page 7
- Page 8
- Page 9
- Page 10
- Page 11
- Page 12
- Page 13
- Page 14
- Page 15
- Page 16
- Page 17
- Page 18
- Page 19
- Page 20
- Page 21
- Page 22
- Page 23
- Page 24
- Page 25
- Page 26
- Page 27
- Page 28
- Page 29
- Page 30
- Page 31
- Page 32
- Page 33
- Page 34
- Page 35
- Page 36
- Page 37
- Page 38
- Page 39
- Page 40
- Page 41
- Page 42
- Page 43
- Page 44
- Page 45
- Page 46
- Page 47
- Page 48
- Page 49
- Page 50
- Page 51
- Page 52
- Page 53
- Page 54
- Page 55
- Page 56
- Page 57
- Page 58
- Page 59
- Page 60
- Page 61
- Page 62
- Page 63
- Page 64
- Page 65
- Page 66
- Page 67
- Page 68
- Page 69
- Page 70
- Page 71
- Page 72
- Page 73
- Page 74
- Page 75
- Page 76
- Page 77
- Page 78
- Page 79
- Page 80
- Flash version
© UniFlip.com
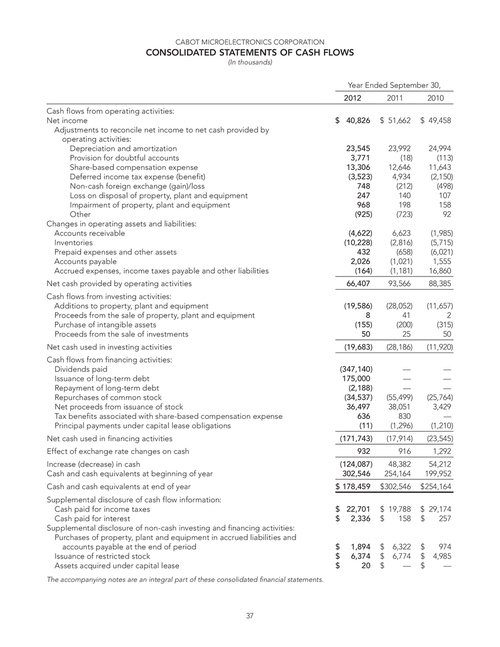
CABOT MICROELECTRONICS CORPORATION
CONSOLIDATED STATEMENTS OF CASH FLOWS
(In thousands)
Year Ended September 30, 2012 Cash flows from operating activities: Net income Adjustments to reconcile net income to net cash provided by operating activities: Depreciation and amortization Provision for doubtful accounts Share-based compensation expense Deferred income tax expense (benefit) Non-cash foreign exchange (gain)/loss Loss on disposal of property, plant and equipment Impairment of property, plant and equipment Other Changes in operating assets and liabilities: Accounts receivable Inventories Prepaid expenses and other assets Accounts payable Accrued expenses, income taxes payable and other liabilities Net cash provided by operating activities Cash flows from investing activities: Additions to property, plant and equipment Proceeds from the sale of property, plant and equipment Purchase of intangible assets Proceeds from the sale of investments Net cash used in investing activities Cash flows from financing activities: Dividends paid Issuance of long-term debt Repayment of long-term debt Repurchases of common stock Net proceeds from issuance of stock Tax benefits associated with share-based compensation expense Principal payments under capital lease obligations Net cash used in financing activities Effect of exchange rate changes on cash Increase (decrease) in cash Cash and cash equivalents at beginning of year Cash and cash equivalents at end of year Supplemental disclosure of cash flow information: Cash paid for income taxes Cash paid for interest Supplemental disclosure of non-cash investing and financing activities: Purchases of property, plant and equipment in accrued liabilities and accounts payable at the end of period Issuance of restricted stock Assets acquired under capital lease
The accompanying notes are an integral part of these consolidated financial statements.
2011 $ 51,662 23,992 (18) 12,646 4,934 (212) 140 198 (723) 6,623 (2,816) (658) (1,021) (1,181) 93,566 (28,052) 41 (200) 25 (28,186) — — — (55,499) 38,051 830 (1,296) (17,914) 916 48,382 254,164 $ 302,546 $ 19,788 $ 158 $ $ $ 6,322 6,774 —
2010 $ 49,458 24,994 (113) 11,643 (2,150) (498) 107 158 92 (1,985) (5,715) (6,021) 1,555 16,860 88,385 (11,657) 2 (315) 50 (11,920) — — — (25,764) 3,429 — (1,210) (23,545) 1,292 54,212 199,952 $ 254,164 $ 29,174 $ 257 $ $ $ 974 4,985 —
$ 40,826 23,545 3,771 13,306 (3,523) 748 247 968 (925) (4,622) (10,228) 432 2,026 (164) 66,407 (19,586) 8 (155) 50 (19,683) (347,140) 175,000 (2,188) (34,537) 36,497 636 (11) (171,743) 932 (124,087) 302,546 $ 178,459 $ 22,701 $ 2,336 $ $ $ 1,894 6,374 20
37