- Page 1
- Page 2
- Page 3
- Page 4
- Page 5
- Page 6
- Page 7
- Page 8
- Page 9
- Page 10
- Page 11
- Page 12
- Page 13
- Page 14
- Page 15
- Page 16
- Page 17
- Page 18
- Page 19
- Page 20
- Page 21
- Page 22
- Page 23
- Page 24
- Page 25
- Page 26
- Page 27
- Page 28
- Page 29
- Page 30
- Page 31
- Page 32
- Page 33
- Page 34
- Page 35
- Page 36
- Page 37
- Page 38
- Page 39
- Page 40
- Page 41
- Page 42
- Page 43
- Page 44
- Page 45
- Page 46
- Page 47
- Page 48
- Page 49
- Page 50
- Page 51
- Page 52
- Page 53
- Page 54
- Page 55
- Page 56
- Page 57
- Page 58
- Page 59
- Page 60
- Page 61
- Page 62
- Page 63
- Page 64
- Page 65
- Page 66
- Page 67
- Page 68
- Page 69
- Page 70
- Page 71
- Page 72
- Page 73
- Page 74
- Page 75
- Page 76
- Page 77
- Page 78
- Page 79
- Page 80
- Flash version
© UniFlip.com
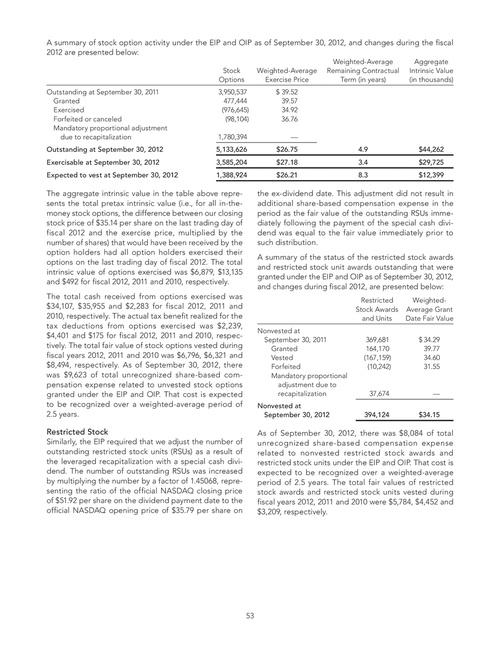
A summary of stock option activity under the EIP and OIP as of September 30, 2012, and changes during the fiscal 2012 are presented below:
Stock Options Outstanding at September 30, 2011 Granted Exercised Forfeited or canceled Mandatory proportional adjustment due to recapitalization Outstanding at September 30, 2012 Exercisable at September 30, 2012 Expected to vest at September 30, 2012 3,950,537 477,444 (976,645) (98,104) 1,780,394 5,133,626 3,585,204 1,388,924 Weighted-Average Exercise Price $ 39.52 39.57 34.92 36.76 — $26.75 $27.18 $26.21 4.9 3.4 8.3 $44,262 $29,725 $12,399 Weighted-Average Remaining Contractual Term (in years) Aggregate Intrinsic Value (in thousands)
The aggregate intrinsic value in the table above represents the total pretax intrinsic value (i.e., for all in-themoney stock options, the difference between our closing stock price of $35.14 per share on the last trading day of fiscal 2012 and the exercise price, multiplied by the number of shares) that would have been received by the option holders had all option holders exercised their options on the last trading day of fiscal 2012. The total intrinsic value of options exercised was $6,879, $13,135 and $492 for fiscal 2012, 2011 and 2010, respectively. The total cash received from options exercised was $34,107, $35,955 and $2,283 for fiscal 2012, 2011 and 2010, respectively. The actual tax benefit realized for the tax deductions from options exercised was $2,239, $4,401 and $175 for fiscal 2012, 2011 and 2010, respectively. The total fair value of stock options vested during fiscal years 2012, 2011 and 2010 was $6,796, $6,321 and $8,494, respectively. As of September 30, 2012, there was $9,623 of total unrecognized share-based compensation expense related to unvested stock options granted under the EIP and OIP. That cost is expected to be recognized over a weighted-average period of 2.5 years.
the ex-dividend date. This adjustment did not result in additional share-based compensation expense in the period as the fair value of the outstanding RSUs immediately following the payment of the special cash dividend was equal to the fair value immediately prior to such distribution. A summary of the status of the restricted stock awards and restricted stock unit awards outstanding that were granted under the EIP and OIP as of September 30, 2012, and changes during fiscal 2012, are presented below:
Restricted Stock Awards and Units Nonvested at September 30, 2011 Granted Vested Forfeited Mandatory proportional adjustment due to recapitalization Nonvested at September 30, 2012 369,681 164,170 (167,159) (10,242) WeightedAverage Grant Date Fair Value $ 34.29 39.77 34.60 31.55
37,674 394,124
— $34.15
Restricted Stock
Similarly, the EIP required that we adjust the number of outstanding restricted stock units (RSUs) as a result of the leveraged recapitalization with a special cash dividend. The number of outstanding RSUs was increased by multiplying the number by a factor of 1.45068, representing the ratio of the official NASDAQ closing price of $51.92 per share on the dividend payment date to the official NASDAQ opening price of $35.79 per share on
As of September 30, 2012, there was $8,084 of total unrecognized share-based compensation expense related to nonvested restricted stock awards and restricted stock units under the EIP and OIP. That cost is expected to be recognized over a weighted-average period of 2.5 years. The total fair values of restricted stock awards and restricted stock units vested during fiscal years 2012, 2011 and 2010 were $5,784, $4,452 and $3,209, respectively.
53