- Page 1
- Page 2
- Page 3
- Page 4
- Page 5
- Page 6
- Page 7
- Page 8
- Page 9
- Page 10
- Page 11
- Page 12
- Page 13
- Page 14
- Page 15
- Page 16
- Page 17
- Page 18
- Page 19
- Page 20
- Page 21
- Page 22
- Page 23
- Page 24
- Page 25
- Page 26
- Page 27
- Page 28
- Page 29
- Page 30
- Page 31
- Page 32
- Page 33
- Page 34
- Page 35
- Page 36
- Page 37
- Page 38
- Page 39
- Page 40
- Page 41
- Page 42
- Page 43
- Page 44
- Page 45
- Page 46
- Page 47
- Page 48
- Page 49
- Page 50
- Page 51
- Page 52
- Page 53
- Page 54
- Page 55
- Page 56
- Page 57
- Page 58
- Page 59
- Page 60
- Page 61
- Page 62
- Page 63
- Page 64
- Page 65
- Page 66
- Page 67
- Page 68
- Page 69
- Page 70
- Page 71
- Page 72
- Page 73
- Page 74
- Page 75
- Page 76
- Page 77
- Page 78
- Page 79
- Page 80
- Flash version
© UniFlip.com
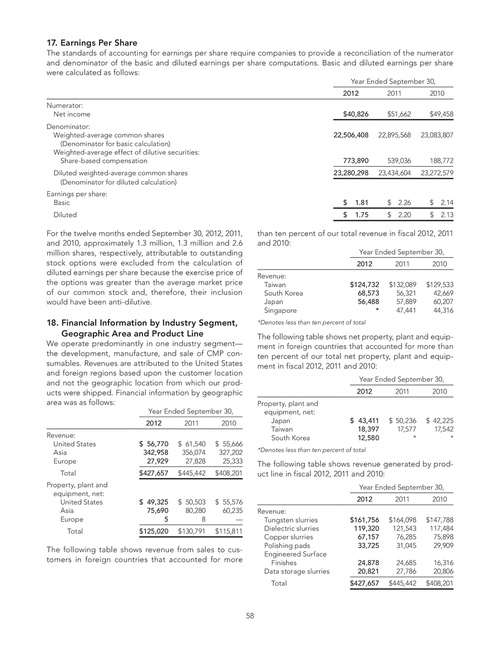
17. Earnings Per Share
The standards of accounting for earnings per share require companies to provide a reconciliation of the numerator and denominator of the basic and diluted earnings per share computations. Basic and diluted earnings per share were calculated as follows:
Year Ended September 30, 2012 Numerator: Net income Denominator: Weighted-average common shares (Denominator for basic calculation) Weighted-average effect of dilutive securities: Share-based compensation Diluted weighted-average common shares (Denominator for diluted calculation) Earnings per share: Basic Diluted $40,826 22,506,408 773,890 23,280,298 2011 $51,662 22,895,568 2010 $49,458 23,083,807
539,036 23,434,604
188,772 23,272,579
$ $
1.81 1.75
$ $
2.26 2.20
$ $
2.14 2.13
For the twelve months ended September 30, 2012, 2011, and 2010, approximately 1.3 million, 1.3 million and 2.6 million shares, respectively, attributable to outstanding stock options were excluded from the calculation of diluted earnings per share because the exercise price of the options was greater than the average market price of our common stock and, therefore, their inclusion would have been anti-dilutive.
than ten percent of our total revenue in fiscal 2012, 2011 and 2010:
Year Ended September 30, 2012 Revenue: Taiwan South Korea Japan Singapore $124,732 68,573 56,488 * 2011 $132,089 56,321 57,889 47,441 2010 $129,533 42,669 60,207 44,316
18. Financial Information by Industry Segment, Geographic Area and Product Line
We operate predominantly in one industry segment— the development, manufacture, and sale of CMP consumables. Revenues are attributed to the United States and foreign regions based upon the customer location and not the geographic location from which our products were shipped. Financial information by geographic area was as follows:
Year Ended September 30, 2012 Revenue: United States Asia Europe Total Property, plant and equipment, net: United States Asia Europe Total $ 56,770 342,958 27,929 $427,657 2011 $ 61,540 356,074 27,828 $ 445,442 2010 $ 55,666 327,202 25,333 $ 408,201
*Denotes less than ten percent of total
The following table shows net property, plant and equipment in foreign countries that accounted for more than ten percent of our total net property, plant and equipment in fiscal 2012, 2011 and 2010:
Year Ended September 30, 2012 Property, plant and equipment, net: Japan Taiwan South Korea 2011 2010
$ 43,411 18,397 12,580
$ 50,236 17,577 *
$ 42,225 17,542 *
*Denotes less than ten percent of total
The following table shows revenue generated by product line in fiscal 2012, 2011 and 2010:
Year Ended September 30, 2012 Revenue: Tungsten slurries Dielectric slurries Copper slurries Polishing pads Engineered Surface Finishes Data storage slurries Total $161,756 119,320 67,157 33,725 24,878 20,821 $427,657 2011 $ 164,098 121,543 76,285 31,045 24,685 27,786 $ 445,442 2010 $ 147,788 117,484 75,898 29,909 16,316 20,806 $ 408,201
$ 49,325 75,690 5 $125,020
$ 50,503 80,280 8 $ 130,791
$ 55,576 60,235 — $ 115,811
The following table shows revenue from sales to customers in foreign countries that accounted for more
58